The market’s sector rotation has favored tech stocks since April. Investors and traders have been looking to diversify away from the dividend play ahead of potentially higher interest rates.
Today, three stock charts come into focus: Cisco Systems, Inc. (NASDAQ:CSCO), Baidu Inc (ADR) (NASDAQ:BIDU) and AbbVie Inc (NYSE:ABBV). All three are signaling that patient traders soon will have a chance to profit.
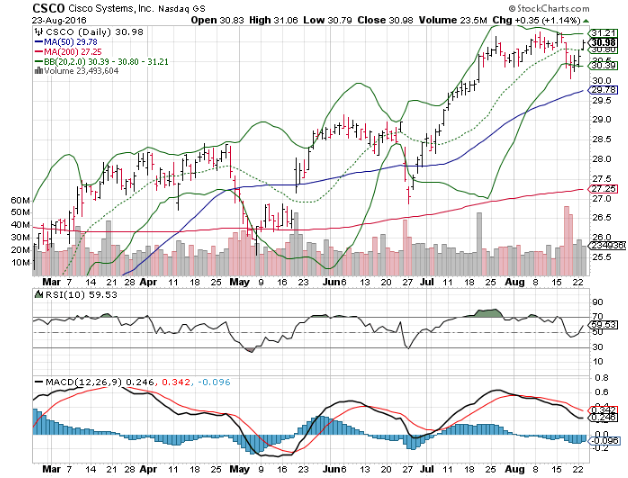
Cisco Systems, Inc. (CSCO)

Cisco is an old-school tech firm that has reinvented itself back into an industry leader. Seemingly left for dead (OK, we’re embellishing a bit), the networking company has benefited from the “Internet of Things” movement.
CSCO’s stock chart shows consolidation at the $31 level that has held the shares back for the past month, despite the market’s ability to melt higher. The slight relative strength lag gives the impression that Cisco’s run could be over. Not true.
We’re watching for another dip in the stock over the next few weeks as September trading begins. Volatility is likely to come back into the picture, and that should bring CSCO shares back to the $29.75 level, which will signal a buying opportunity for investors.
Momentum remains positive on Cisco, despite the consolidation at $31. Also, the short-term RSI is drifting toward an oversold reading, even though the stock hasn’t seen much selling. One push lower will have this stock officially oversold, triggering the bullish technical traders into buy mode.
Bottom line: The charts say that patient investors can get a big technical performer in CSCO soon. Keep this near the top of your list.
Baidu Inc (ADR) (BIDU)

Chinese search engine provider Baidu has made a nice little run following their earnings report earlier this month, but the technical tank appears empty to drive through key overhead resistance.
Bidu shares spent a lot of time doing nothing while the rest of the market was in rally mode, making it a relative strength laggard. After their earnings in late July, the stock rallied almost 14%, but is stalling as it faces its 200-day moving average, which is now transitioning into a declining pattern.
In addition to the trendline resistance from the 200-day, Baidu shares are coming off of a technically overbought signal that triggered on August 19. The last similar signal resulted in a 13% decline in shares over a two-week trading period.
It’s fair to say that a stock can rally further, despite being overbought, but the MACD indicator for Baidu suggest that there is not enough momentum behind shares right now to push higher, instead the stock is more likely to revert to the mean which will land it in the area of $166, at which point it is likely to become a technical “buy”. Again, another technology company where patience will pay.
AbbVie Inc (ABBV)
For the last two years biotechnology company Abbvie has been a relative strength leader among its peers. For comparison, Abbvie is up 50% since the October 2015 bottom whereas the Biotechnology ETF (XBI) is still trading about 10% lower over the same period.
Shorter-term, Abbvie shares have put on another impressive rally as they moved from $58 to $66 since late June, but that rally has stalled after their latest earnings report. Now, the stock is consolidating across the $67 level and appears to be setting up for a short-term pullback, which would be healthy.
Momentum has turned slightly negative, suggesting that the sellers are starting to affect the daily price change of Abbvie. That said, strong technical trendline support is in place at $64 and $60, support that will draw technical buyers into the market to grab Abbvie on any weakness as it presents a technical “value.”
The technical picture looks to play out like this for Abbvie…. Short-term selling will take the shares to their 200-day moving average at $60 which will also cause a short-term technical oversold condition to occur. At that point, technicians will come into the market as buyers pushing the stock back towards the top of its range.
Patient traders will hold-off for this pending buying opportunity on Abbvie shares at $60.
As of this writing, Johnson Research Group did not hold a position in any of the aforementioned securities.