Some trading sessions leave little to talk about. Trends keep trending, volume remains subdued and the market drifts to little fanfare. Thursday was not one of those days. Small-caps stole the show in a take-no-prisoners rally that left bears shellshocked. That’s right, friends. The iShares Russell 2000 ETF (NYSEARCA:IWM) — long since left in the dust by its larger-cap brethren — is back!

 The IWM soared just shy of 2% on heavy, heavy volume yesterday. The only thing that stopped the advance was the closing bell.
This wasn’t some toe-dip back into the little-guy waters. Investors were diving headfirst into stocks that had previously been left in the dust.
It’s a wonderful example of sector rotation. While tech stocks cooled their jets — the Technology Select Sector SPDR Fund (NYSEARCA:XLK) rallied a scant 0.25% — retail, biotech, oil and financial stocks were all revving their engines.
Small-caps have been stuck in neutral virtually the entire year. IWM entered Thursday’s trading session virtually unchanged in 2017. Compared to the Nasdaq’s substantial gains we’re talking about some serious underperformance in IWM. Not that delta-neutral option sellers are complaining. A sideways shuffle is just what the doctor ordered for credit spread and condor sellers.
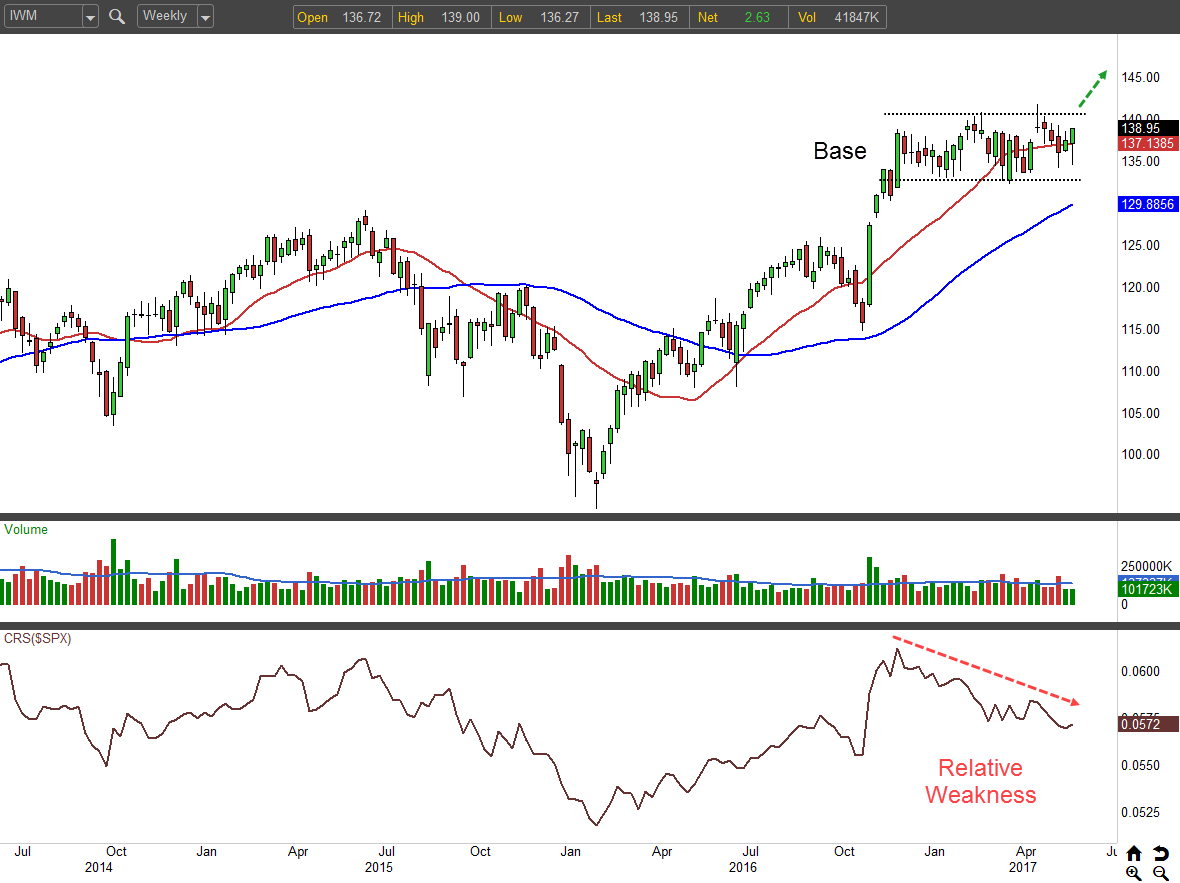
Take note of the Comparative Relative Strength (CRS) indicator shown in the lower panel of the accompanying weekly chart. Its downtrend over the past six months confirms IWM’s weak-sauce behavior.
Click to Enlarge
But if Thursday’s pop is a sign of things to come, we could finally see IWM start trending again.
The base that has formed in recent months could serve as a launchpad for small-caps next ascent. Breaking out of a long-term base is quite the promising technical setup. As the old saw goes, “the longer the base, the higher in space.” While we’re a ways from a breakout (IWM needs to climb above $141), this is certainly one potential outcome worth anticipating.
For greater detail, let’s drill down to the daily chart, and then we’ll tackle a trade idea.
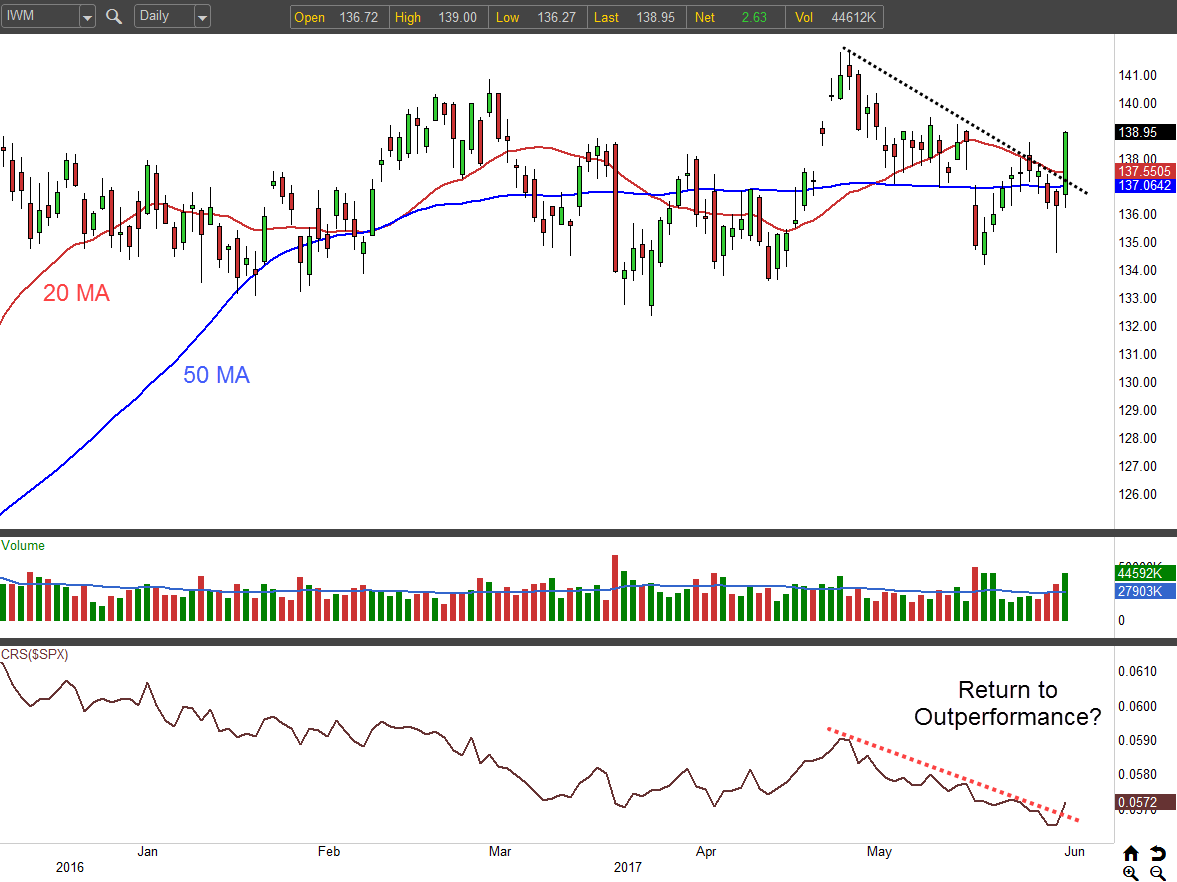
Though moving averages carry little significance during trading ranges, it’s worth noting today’s rally lifted IWM back above both its 20- and 50-day moving averages.
Click to Enlarge
The fund breached a short-term descending trendline (dotted black line) today as well. If buyers press their advantage here, we could see continuation to the upper end of its multimonth range near $141.
I also like that the relative strength indicator was able to pop above its descending trendline showing the return of outperformance. Time will tell if it holds, but buyers have definitely established a foothold here.
IWM Bull Call Spreads
If you’re interested in upping your exposure to small-caps, consider buying a bull call spread.
The long call vertical consists of buying to open the Jul$138 call while selling to open the Jul $142 call for around $2.00. The max risk is limited to the initial $2 cost, but to lose the whole nut, you would need to ride all the way to expiration and have the IWM ETF sitting below $138.
The max reward is limited to the spread width ($4) minus the initial debit, or $2. To capture the entire gain, IWM needs to rise above $142 by expiration.
By risking $2 to win $2, the spread offers a potential 100% reward.
As of this writing, Tyler Craig held short option positions in IWM and RUT.