Stocks are starting the month of September on a positive note after the jobs report for August provided another bullish catalyst for traders. While the broader market indices were able to beat the seasonality trends in August with slight gains, the fact is that stocks continue to trade with lower correlations. This means that picking the right stocks is becoming increasingly important.
Today’s three big stock charts review the recent price activity of Automatic Data Processing (NASDAQ:ADP), Amazon.com, Inc. (NASDAQ:AMZN) and Citrix Systems, Inc. (NASDAQ:CTXS) as three stocks with charts that are signaling a tradable move that investors may want to consider.
Automatic Data Processing (ADP)

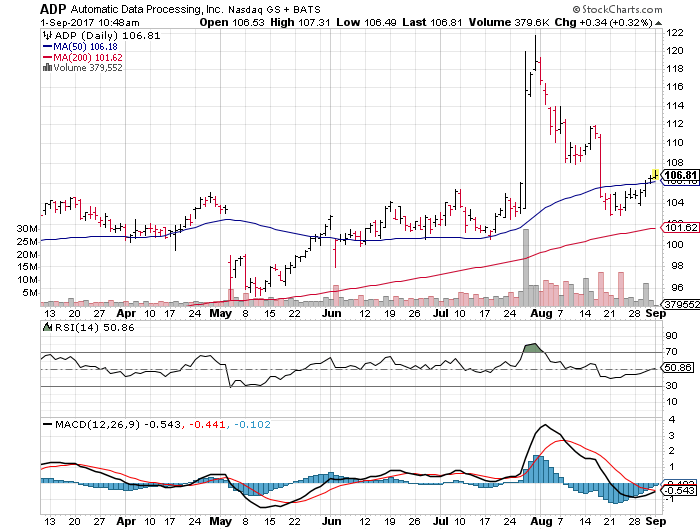
This morning’s jobs report gave another indication that the jobs market remains robust, despite a slight uptick in the unemployment rate. We’ve talked for a long time about the positive fundamental narrative that this creates for payroll companies. Well, that story has translated into strengthening technicals for ADP that are now generating another bullish opportunity.
- Automatic Data Processing shares recently bounced from the $104-level again. This chart support has been strong for the stock through all of 2017. The bounce from this otherwise resistance level for ADP indicates that the bulls are now taking charge of the trend.
- According to the MACD, we’re seeing momentum build in Automatic Data Processing shares as they approach a critical technical test that will draw another round of buyers into the stock.
- ADP shares have crossed back above their 50-day moving average. This trendline has also transitioned into a bullish pattern. The combination targets higher prices over the next 4-6 weeks.
Amazon.com, Inc. (AMZN)
Amazon shares continue to waver and trade in a tightening range over the last month as the battle between brick-and-mortar and online retail continues to get more interesting. This morning, Lululemon Athletica Inc. (NASDAQ:LULU) beat analyst estimates and upgraded its outlook.
Is it over for AMZN? No, but the chart is suggesting that more weakness may be in the cards before you should buy.
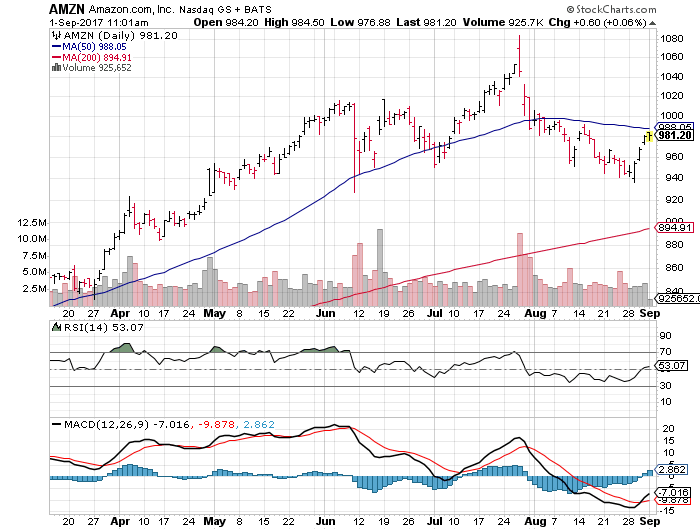
- After losing a chart battle with the $1,000 price, Amazon shares are slipping into an intermediate-term bearish pattern. This is the first time that we have seen AMZN stock move into this pattern in a year, ahead of a 12% decline in the shares.
- The 50-day moving average for Amazon has rolled over, indicating a change in the trend as selling pressure and volume increases.
- The pattern of lower highs and lower lows that has formed over the last two months suggests that we may see AMZN stock test its 200-day moving average before the technicians step in. This would be another 8% decline from current prices.
Citrix Systems, Inc. (CTXS)
Citrix Systems stock is trading right into a critical technical test that may be signaling a longer-term reversal and an opportunity for investors to jump on this technology stock as it breaks into a new bullish trend with potential for a 10% rally.
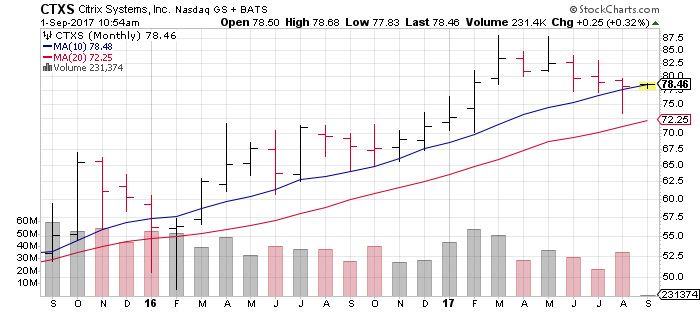
- CTXS stock is currently finding support at its longer-term 10-month moving average, the stock survived the volatility of August after dipping below this important trendline, but starts September with strong support and a potential technical catalyst impending.
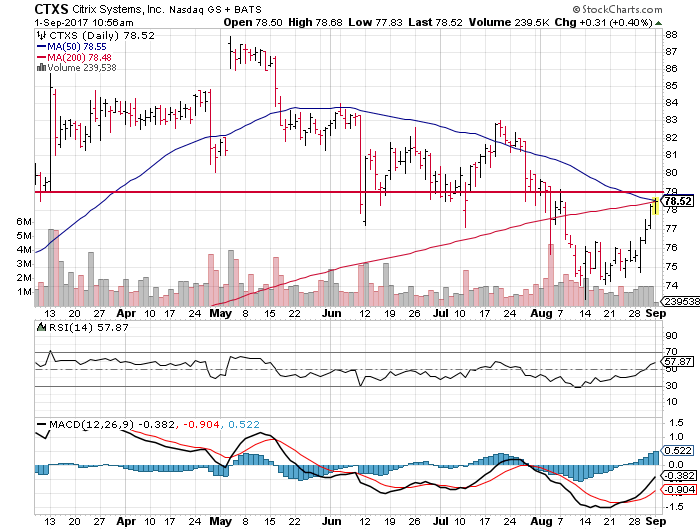
- The recent rally from $74 has put Citrix shares in a position to break above their 50- and 200-day moving average at the same time as they converge at $78.50. A simultaneous break above these critical trendlines will bring the bulls into the market.
- Immediately after a break above the 50- and 200-day moving averages CTXS will face chart resistance at $79. This has served as a consolidation level in June and July, meaning that a move higher will bring even more buyers into the market pushing Citrix towards its next technical target of $83.
 As of this writing, Johnson Research Group did not hold a position in any of the aforementioned securities.