Though Monday was a lethargic day, nestled between a weekend and a market holiday, stocks ended the year on a modestly high note. The S&P 500’s close of 2506.85 before Tuesday’s break was 0.85% higher than Friday’s last trade.
 Netflix (NASDAQ:NFLX) set the tone — and the pace — rallying 4.5% mostly in response to news that its original film, Bird Box, had drawn in a massive number of views during its first seven days of availability. The success underscores the idea that Netflix doesn’t need content from other studios. Not far behind was the 3.6% pop from Advanced Micro Devices (NASDAQ:AMD), for no other discernible reason than traders wanted to start the new year with the popular stock already in-hand.
The broad market gain took shape in spite of the setback suffered by Weight Watchers International (NASDAQ:WTW), however. WTW was off to the tune of 6.6% not on any specific news, but rather, as traders ultimately decided to dump the poorly performing stock as a means of securing a tax loss in 2018.
Headed into Wednesday’s action, the new year means a new slate, which means anything could happen. Stock charts of Valero Energy (NYSE:VLO), Procter & Gamble (NYSE:PG) and Dentsply (NASDAQ:XRAY), however, look likely they’ve already charted a course as the new year kicks off.
Valero Energy (VLO)
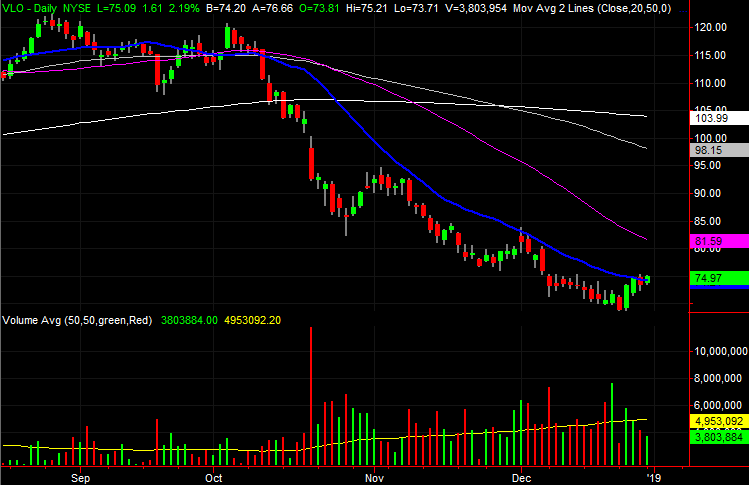
It has got more to do with the overall energy sector’s recent past and plausible future. But, of all the names that could rebound as oil prices turnaround — or at least stabilize — Valero Energy is better positioned than most.
And, as of Monday’s close, VLO has cleared a hurdle that few were watching all that closely.

Click to Enlarge
• In the weekly timeframe, Valero share are well oversold, as indicated by the RSI indicator and the stochastic indicator. Actually, the RSI indicator is now out of its oversold condition, which is a buy signal in and of itself.
Procter & Gamble (PG)
The past several years have been trying ones for Procter & Gamble, and by extension, for shareholders. Once a titan within the consumer goods world, the advent of the internet and the competition from specialized rivals it fosters caught P&G unaware.
The past year, however, has not only been one of effective regrouping, but also one that has rekindled the stock’s bullishness. Though up and down a little bit in the past few weeks, the stock’s drawn some key lines in the sand that have shaped the foreseeable future.
Click to Enlarge
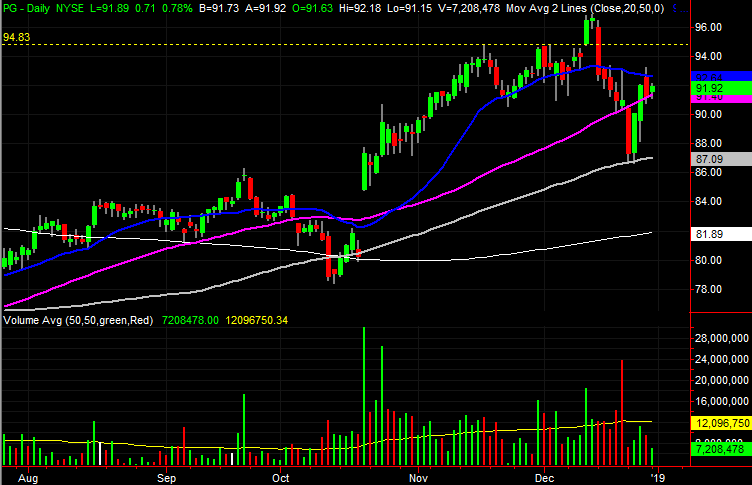
• Since then, PG shares have been unable to move above the blue 20-day moving average line, though the purple 50-day moving average line has served as support over the past couple of trading days.
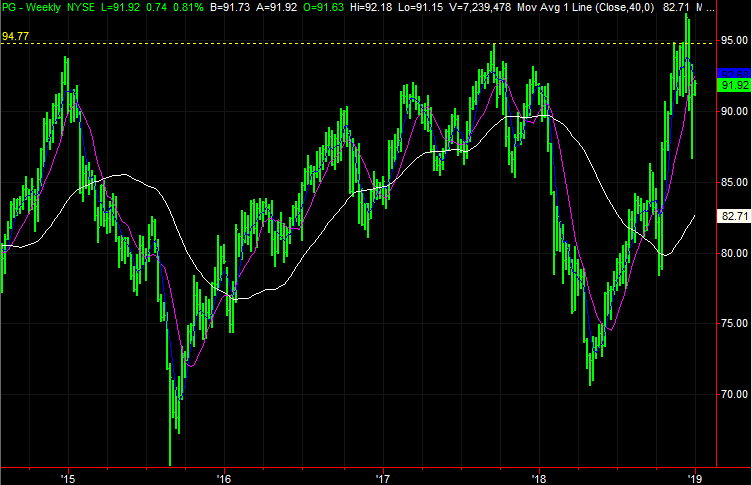
• The next big hurdle from here is $94.83, plotted with a yellow dashed line on both stock charts. Clearing that ceiling translates into a whole new psychological paradigm for investors watching PG stock.
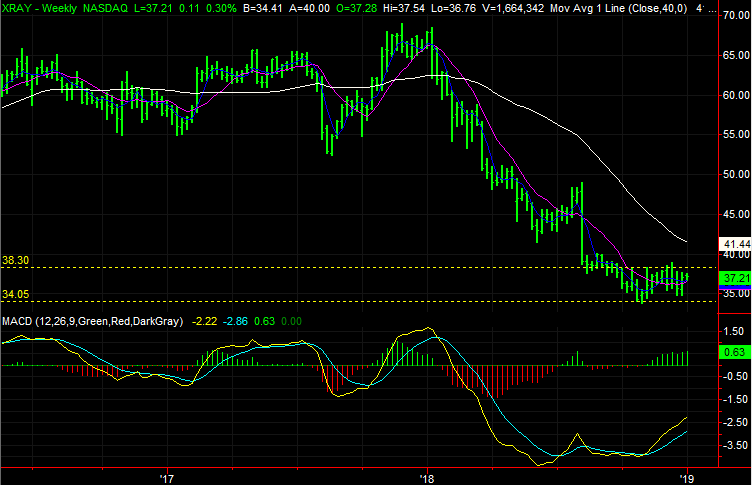
Dentsply (XRAY)
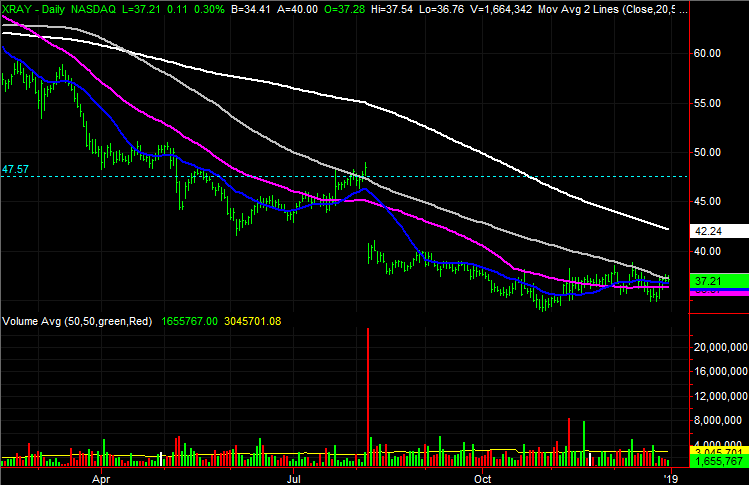
Finally, with nothing more than a quick glance, Dentsply looks like it’s doing nothing more than dishing out more volatility. Take a closer, longer look though. Slowly but surely, XRAY has wiggled its way into a position that could put it back in a bullish groove.
Better yet, Denstply has some clear ceilings and triggers that will help shape any near-term recovery that has a shot at turning into a longer-term recovery.
Click to Enlarge
• In the meantime, the blue 20-day moving average line has crossed above the purple 50-day line, and both of those lines are about to move above the 100-day line. That’s a sign that the short-term uptrend is developing momentum.
• When we zoom out to the weekly chart of Dentsply, we not only see a bullish MACD indicator, but that XRAY shares are actually going through a consolidation phase between $34 and $38. That’s the groundwork for an unwinding of 2018’s meltdown. Hurdling the upper edge of that range could be catalytic.
As of this writing, James Brumley did not hold a position in any of the aforementioned securities. You can follow him on Twitter, at @jbrumley.