It was neither pretty nor sizeable, but a small gain is better than any-sized loss. The S&P 500 advanced 0.09% on Friday to lead the index to its best weekly close since November.
Exxon Mobil (NYSE:XOM) led the way with its 3.6% following an impressive fourth-quarter report that inspired similar performances from other energy names. Deckers Outdoor (NYSE:DECK) was the big winner for the day though, gaining 10.5% on the heels of its Q4 numbers.
Sony (NYSE:SNE) was at the other end of that spectrum, losing nearly 8% on Friday following the release of its quarterly figures. Profits broke records, but its all-important video gaming division is running into an alarming headwind.
None of those names are worth trading today, however … too much volatility leads to unpredictable reactions. Rather, it’s the stock charts of Micron Technology (NASDAQ:MU), LyondellBasell Industries (NYSE:LYB) and Morgan Stanley (NYSE:MS) that look like they’ve got the more developed, trade-worthy trends in the works.
Micron Technology (MU)
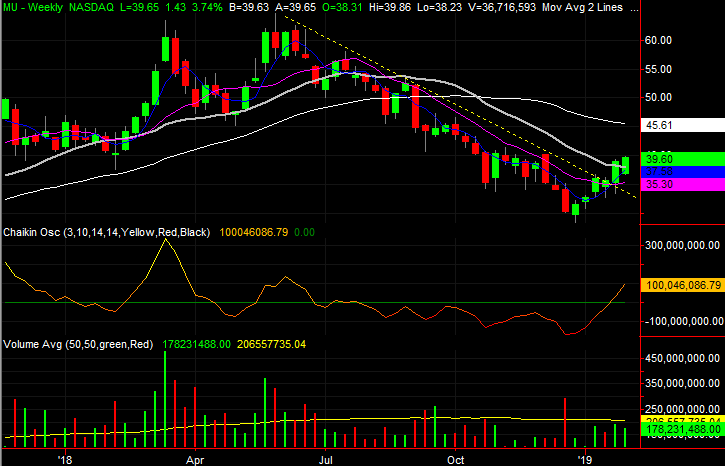
Last week, it was pointed out that Micron Technology was testing resistance at its 100-day moving average line, after hurdling a long-standing resistance line that had guided it lower for the better part of 2018.
On Friday, the 100-day line was cleared as well, and in just the right way.
Click to Enlarge
• Zooming out to the weekly chart we can put the whole matter in perspective. Micron was brutalized last year, but has taken on a much different tone this year, with old lines in the sand being crossed.
• Particularly encouraging is the amount of bullish volume we’ve already seen unfurl. We get a feel for this by judging the height of the green bars on the daily chart, but the weekly chart’s Chaikin line moving above zero quantifies the idea.
LyondellBasell Industries (LYB)
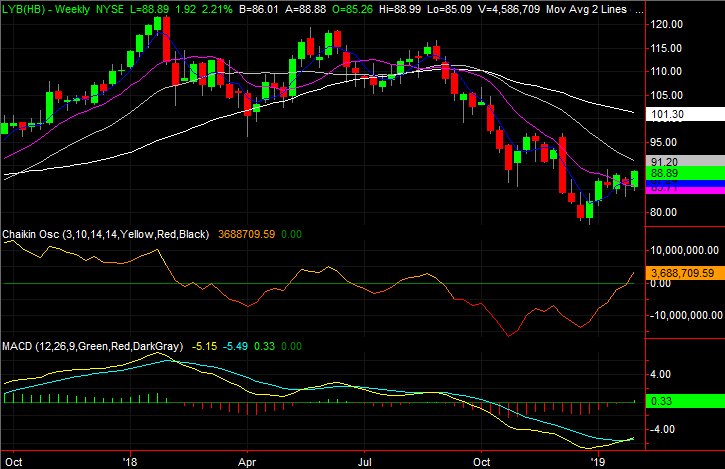
LyondellBasell Industries was one of the hardest-hit names late last year, falling from a higher near $115 in September to a low around $77 in late September. The rebound effort in the meantime could easily be viewed as nothing more than a dead-cat bounce.
As of Friday though (and with Friday’s unique bar in mind), there may be more to the renewed rally than just circumstances. This gain just grew legs.
Click to Enlarge
• Zooming out to the weekly chart, we’ve got two bigger-picture bullish clues. One of them is the first MACD cross since the middle of last year. The other is the Chaikin line’s cross back above zero, confirming there’s good volume behind the bullish action.
• The technical ceiling around $88.40, marked with a yellow dashed line, needs to be cleared. But, hurdling it could be catalytic after a string of higher lows since December.
Morgan Stanley (MS)

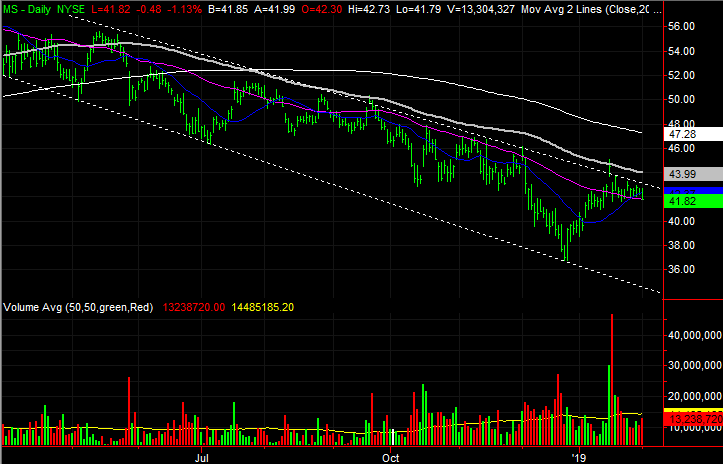
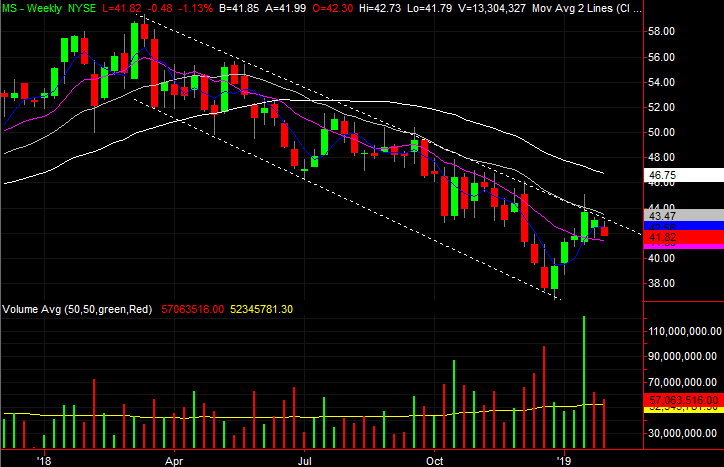
More than once over the course of the past few months, Morgan Stanley has been a featured stock chart. It has been trapped by falling support and resistance line, and can’t escape. The travel in between these two extremes has made for decent trading.
Right on cue, MS bumped into that upper ceiling again a couple of weeks ago, and began the process of pulling back again. As of Friday, the stock’s dangerously close to fulfilling that potential move.
Click to Enlarge
• It’s difficult to see on the daily chart, but as of Friday, Morgan Stanley shares are back below the 50-day moving average line.
• If the budding moves takes shape as history suggests it will, the selloff may not stop until the lower edge of the falling trading range is met somewhere around $34… an extreme move from a blue chip in a pretty healthy environment.
As of this writing, James Brumley did not hold a position in any of the aforementioned securities. You can follow him on Twitter, at @jbrumley.