The bulls came back to the table in a big way on Tuesday, slightly more convinced there’s less risk of another government shutdown, and slightly more convinced the tariff war will eventually come to a close. All told, the S&P 500 gained 1.29% on Tuesday, though it still hasn’t hurdled some key technical resistance.
It wasn’t terribly familiar names leading the charge though. Apple (NASDAQ:AAPL) was a relative no-show, and General Electric (NYSE:GE) stumbled again.
Setting the tone, and the pace, were names like Vale (NYSE:VALE) and Activision Blizzard (NASDAQ:ATVI). Vale jumped 5.6%, snapping back from a pretty severe beatdown following news that a dam break in Brazil could crimp output as well as turn into a massive legal liability. Activision, meanwhile, only bounced on Tuesday after being trounced on Monday in front of Tuesday’s post-close earnings report. As it turns out, the doubters were right to be concerned.
The disparity between the daily winners and the daily losers seems to be widening, in some ways helping identify where the strength and weakness is, but in other ways imposing dangerous volatility. The stock charts of Under Armour (NYSE:UAA), Lennar (NYSE:LEN) and Qualcomm (NASDAQ:QCOM) appear to be developing trends that circumvent that volatility, though in all three cases a little more needs to happen before a budding trend is gelled.
Qualcomm (QCOM)

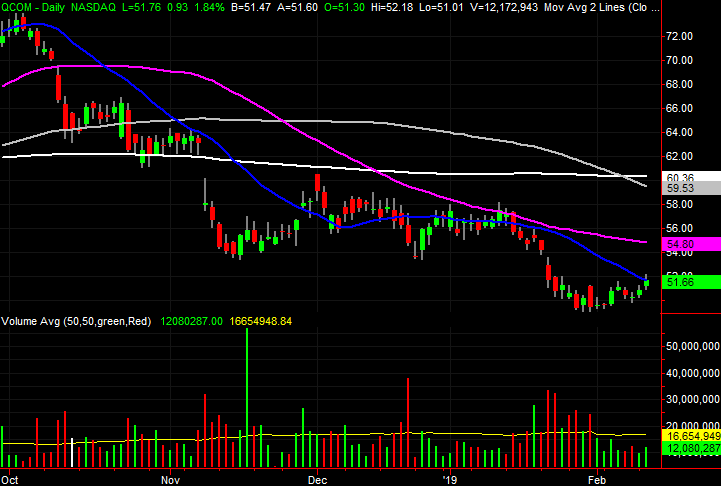
Qualcomm shares have made a little forward progress so far in February. But, given its pullback in January in an environment that was decidedly bullish for most other stocks, it would be easy to think nothing of it.
There may be more at work than seems on the surface, though. Last month’s low was suspiciously familiar.

Click to Enlarge
• If this rebound effort takes hold — and that’s a big “if” — keep a close eye on all the moving average lines plotted on the daily chart. Each has played a support and resistance role at some point in recent months, and will likely do so again.
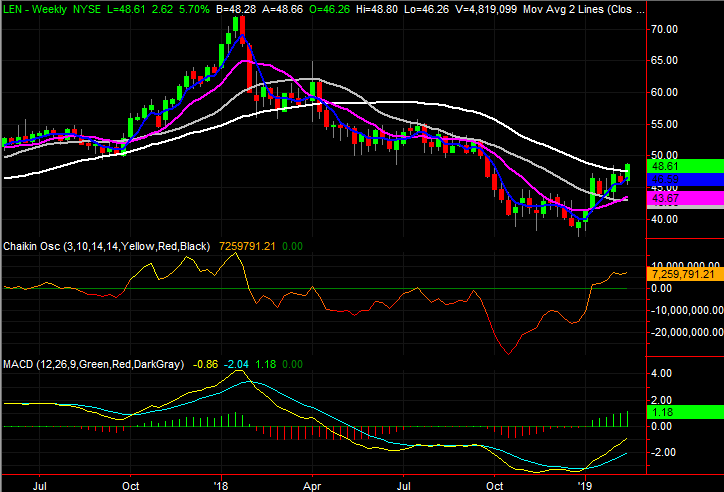
Lennar (LEN)
Last year was a miserable one for Lennar shareholders. Against a backdrop of fears that rising interest rates would up-end the housing construction market (to the extent unaffordable housing wouldn’t), LEN shares fell from a January 2018 peak of $72 to a December low of $37. To that end, any strength seen from then could be easily chalked up as a dead-cat bounce.
The reversal since late last year, however, just took on a completely different complexion. Though more up-and-down movement is certainly in store, LEN just broke above a key technical ceiling that could — and should — trigger higher highs.
Click to Enlarge
• Underscoring yesterday’s compelling move is the volume behind it, and the fact that it was prompted by a push up and off the blue 20-day moving average line.
• While it’s the less likely outcome from here, there’s a chance Lennar shares could complete the head-and-shoulders pattern evident on the weekly chart. A break above the neckline, plotted with a yellow dashed line, could inspire a meltup.
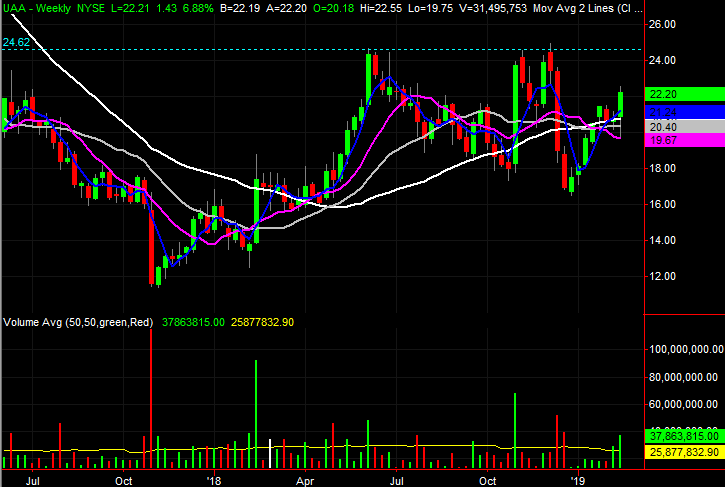
Under Armour (UAA)
Traders have seen big one-day jumps from Under Armour shares before, most of them to no avail. That is, though firmly bullish, those jolts didn’t jump-start prolonged rallies.
Yesterday’s jolt is built a bit differently, however. The near-7% gain overcome a rough start to form a couple of different bullish signals, all in one shot.
Click to Enlarge
• The shape and placement of the bar is also noteworthy. The bears had a chance to put UAA into a nosedive at the opening following its solid fourth-quarter report, but the buyers pushed back harder.
• While a new rally may be underway, the $24.60 area has already been established as a ceiling. That’s where Under Armour shares peaked a couple of different times last year.
As of this writing, James Brumley did not hold a position in any of the aforementioned securities. You can learn more about James at his site, jamesbrumley.com, or follow him on Twitter, at @jbrumley.