Some people are connoisseurs of fine wine.
Some people are connoisseurs of good food.
But if you want to build wealth in the stock, bond, and commodity markets, you must become a “connoisseur of extremes.”
I believe this single concept will put you light years ahead your fellow investors. Knowing it and putting it into practice is one of the defining differences between a skilled financial operator and the typical stock market losers.
Below, I’ll explain this concept and how you can put it to work to drastically increase your net worth.
Most of the time, financial markets are in fairly normal, fairly unremarkable states. They don’t produce sensational headlines in the mainstream financial news.
You know what the sensational headlines look like: “Dow Has Worst Week Since Great Depression” and “Investors Lose Billions in Friday Market Crash.”
However, the world is an ever changing place. You have financial booms, financial busts, wars, panics, amazing innovation, election surprises, interest rate surprises, scandals, and dozens of other catalysts that can cause huge moves in the markets.
By saying you should become a “connoisseur of extremes,” I’m saying you should always be searching for situations where huge price moves place financial markets in drastically different states than normal.
By locating these extreme states – and then betting on conditions returning in the direction of normal – you can consistently make low-risk profits in any type of asset class.
It’s important to realize that extremes can occur in any asset class, from stocks to commodities to real estate to bonds to currencies.
Extremes can be fundamental in nature, like how cheap or expensive a stock market is, for example. Another name for this is a “valuation” extreme.
Like how overbought or oversold a market is, extremes can also be price action based. This is also referred to as “technical analysis.”
Extremes may appear in sentiment readings, like surveys that monitor investor pessimism and optimism.
Let’s cover an extreme in fundamental readings:
A good example of a fundamental valuation extreme came in U.S. stocks in 1982. Back then, stocks became extremely cheap relative to their earnings power.
For U.S. stocks, the normal price-to-earnings multiple over the past hundred years or so is 16. In 1982, the economy and the stock market had been doing so poorly for so long, that people simply gave up on stocks.
Since nobody wanted to own stocks, they became extremely cheap. The price-to-earnings multiple fell to around 8. It was one of the greatest times ever to buy U.S. stocks. The market rose 50% in just one year then doubled by 1986. It rose more than 10 fold over the next 17 years.
Fast forward about two decades and you’ll find the opposite extreme. In 1999, optimism towards stocks was so high that the market reached a price-to-earnings ratio of 33. This was a ridiculous, extreme level of overvaluation.
Remember, the normal price-to-earnings ratio of the past hundred years is around 16. The extreme level of overvaluation made it a terrible time to buy stocks. The market crashed for several years after hitting that extreme.
When it comes to fundamentals, you need to study an asset’s historical valuation and find out what’s normal for that asset. When an asset gets very cheap relative to its historical valuation, we need to consider buying.
When an asset gets extremely expensive relative to its historical valuation, we want to consider avoiding it or even bet on it falling. This goes for oil stocks, tech stocks, real estate, and lots of other assets.
We also see extremes that are technical in nature.
Before we get into particulars, let’s define the term to prevent confusion:
Technical analysis is the study of price action and trading volume to help guide trading and investing decisions. Many people think technical analysis is about predicting the market, but it’s not. It simply comes down to using price and volume data to gauge market action and to help guide decisions. That’s it.
There are dozens of technical indicators that measure a stock’s oversold/overbought levels. One I’ve found useful is the “RSI,” which stands for “relative strength index.” Using the RSI is nothing magical or predictive. It just offers an objective way to gauge the overbought/oversold nature of a stock.
We use these gauges to identify extremes in the market and then to bet on the conditions being “relieved” by a reverse move in the other direction. When the pressure behind an extreme is released, the market tends to snap back like a rubber band stretched to its limit.
There are literally hundreds of technical indicators and chart patterns people use. While I have a handful of things that I know work, what works for me or you or someone else isn’t as important as knowing the overarching goal: That you’re using this stuff to spot extremes.
For example, I often trade short-term moves in blue chip stocks, like Coke and McDonalds. These are elite businesses with tremendous competitive advantages and long histories of treating shareholders well.
Stable blue chips can go through rough patches, like any business. If they report a weak quarter, have a product recall, or any other of a dozen serious-but-solvable problems, the market tends to overact and hammer the shares. The stock price will reach a state we can term “oversold.” This is a condition where the stock has reached an extreme level of poor short-term price action.
It’s around this time that I’ll step in and trade the stock from the long side. World-class businesses have a way of rebounding from short-term setbacks. They tend to snap back from extremely oversold levels.
Now, let’s cover another kind of extreme—sentiment extremes.
Let’s define this term to prevent confusion. The study of market sentiment comes down to gauging the amount of pessimism or optimism towards a given asset. You can gauge the sentiment for just about any kind of asset be it stocks, commodities, real estate or currencies.
While some measures of sentiment can be precisely measured, others cannot. That makes gauging market sentiment probably more art than science.
Whatever gauges you use, the goal is the same: Find extreme levels of pessimism or optimism. You want to find situations where the majority of market participants are extremely bullish or bearish and then bet against them. You want to go against the crowd.
When most folks can’t stand the thought of owning a specific kind of investment, chances are good that it’s cheap and that it’s due for at least a short-term rebound.
On the other hand, when everyone loves an asset, (when everyone loved stocks in 1999, for instance) chances are good that the asset is expensive and due for at least a short-term drop.
A few informal sentiment gauges – the kind that can’t be precisely measured – are magazine covers and cocktail party chatter.
If a mainstream publication like Newsweek or Time has an asset on its cover accompanied by a glowing headline, chances are good that the asset is far too popular, far too expensive, and due for at least a short-term drop.
Magazine publishers have to write stories lots of people want to read. Plus, it’s mostly journalists, not great investors, that write those stories.
Mainstream magazines are just going to write about what’s popular so they can sell lots of magazines. Back in 1999 and 2000, they always had stocks on their covers; it was a danger sign. In 2006, it was all about how to cash in on the real estate boom. That was also a danger sign.
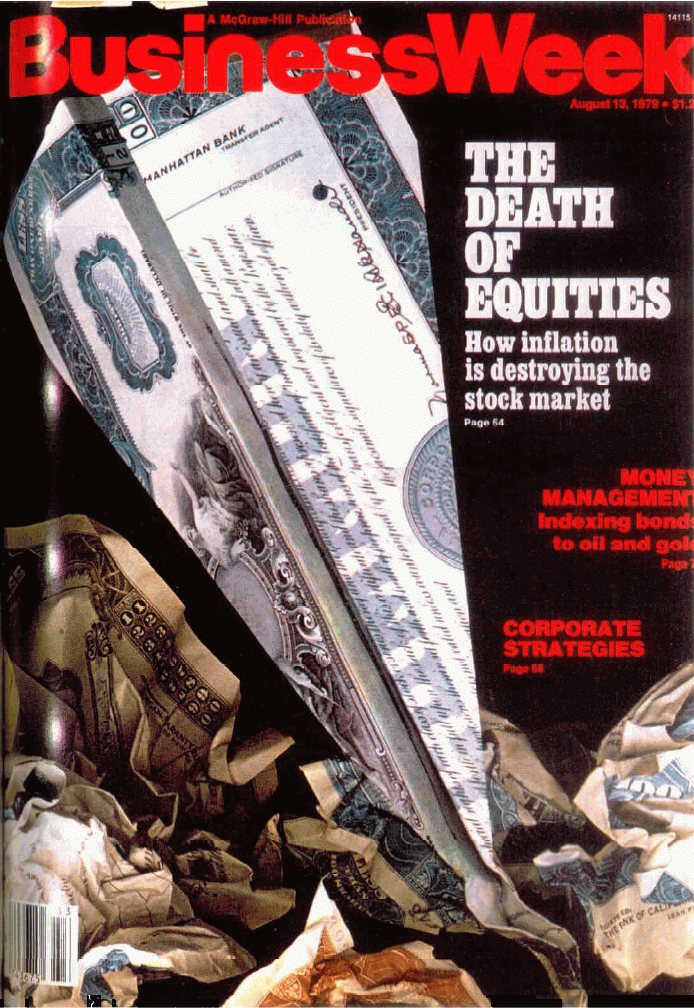
It works the other way as well. Back in 1979, near the bottom of the historic bear market in stocks, BusinessWeek ran a cover story that said, “The Death of Equities.” It was all about how stocks were a terrible investment. This cover came out just before the stock market took off on the huge boom I mentioned earlier.
Noticing cocktail party chatter gives a similar insight. It’s another way to get a feel for what the general public thinks about a given investment.
You can get a feel for this by talking to people at cocktail parties, family gatherings, holiday parties, and dinner parties. When lots of people are excited about a given asset and are buying as much as they can, it’s a major warning sign. Think “Bitcoin” around late 2017, when everyone was raving about it. It’s a sign the asset is too popular, too expensive, and due for a fall. After all, if “everyone” is excited about an investment, and “everyone” has bought it, then who else is left to buy it at a higher price?
On the other hand, when most folks can’t stand the thought of owning a given asset, chances are good that it’s a good buy.
For example, back in 2003, I put a large portion of my net worth in gold. When I’d tell people that I owned a lot of gold, they’d look at me like I was crazy. You could say there was an extreme amount of disinterest in gold. Gold went on to rise many hundreds of percent off its 2003 levels.
It’s important to note that being a “connoisseur of extremes” and trading them is about getting a powerful force of nature to work in your favor.
That force is called “reversion to the mean.”
“Reversion to the mean” is a broad term used to describe the tendency for things in extreme, or abnormal states, to return to more normal states.
You see “reversion to the mean” all the time in sports, academics, business, trading, and dozens of other things.
Winning an NFL Super Bowl requires an extreme set of circumstances, for example. A football team must have a great coach and a great group of players. They have to play extremely well together for an extended period of time. The elite players must avoid injury. The team has to beat a series of excellent teams at the end of the season.
It’s really hard to get all of the stars aligned and achieve a Super Bowl winning season. That’s why Super Bowl winners rarely win the championship again the next year. They tend to “revert to the mean” and not win.
To go back to the example of trading extremely oversold blue-chip stocks, if a blue-chip stock like Coca-Cola is sold heavily day after day for several weeks, chances are good that its trading action will “revert to the mean” and cease being so extreme. Chances are good that it will stop falling and start rising.
Valuation extremes are often accompanied by technical and sentiment extremes.
That’s why I believe studying and trading the market with “just” fundamentals or “just” technicals is a limiting mindset. Consider what happened with offshore drilling stocks in mid-2010, just after the terrible Gulf of Mexico oil well disaster.
After the disaster, investors dumped shares of offshore drilling stocks. They completely overreacted. It was like people believed we’d never be drilling for oil again and sentiment towards the sector was terrible. Even companies with little business exposure to Gulf of Mexico fell more than 30%.
This big decline left the whole sector in an extremely oversold state, also making the stocks very cheap. Great drilling businesses were sold down to valuations of around five times earnings.
After the selloff, you had a sector that was extremely unpopular, extremely cheap, and extremely oversold from a technical standpoint. So, I went long offshore drilling stocks via stock options and made big returns in a short amount of time. The stocks enjoyed a sharp “snapback” rally. Again, this rally was preceded by “extreme” valuation, technical, and sentiment readings.
From time to time, every investor or trader is asked about his market approach. “Are you a fundamentalist or a technician?” is a very common question.
Fundamental investors and traders study things like balance sheets, economic output, and cash flows to develop ideas. Technical analysts study things like chart patterns, price action, trading volume to develop ideas.
Both camps bicker plenty over who is using the “right” approach. I’ve seen a lot of fundamental guys accuse technical guys of being crazy. I’ve seen a lot of technical guys accuse fundamental guys of the same thing.
I believe all the bickering is a waste of time because I have an uncommon view on these things.
In my mind, there is no distinction between fundamental analysis or technical analysis. They are intertwined and inseparable, like the Eastern idea of yin and yang.
Along with sentiment analysis, I see fundamentals and technicals as parts of an interconnected puzzle that is “The Market.”
A market’s fundamentals create the technicals and the sentiment, which in turn affect the fundamentals, creating new technicals and sentiment, further affecting the fundamentals, and so on. This self-reinforcing feedback loop is the basis of George Soros’ theory of reflexivity. In simplistic terms, this is the idea that investors’ perception of the market’s condition affects the market, which in turn affects the investor’s perception. You might think of it as a feedback loop between investors and the market.
So, when someone asks me if I trade using fundamentals or technicals, I reply, “Both. After all, they are the same thing.”
Whatever your approach, make sure it involves you becoming a “connoisseur of extremes.”
Next, I’ll teach you a vital question not enough investors ask: “how many days rich are you?”
Regards,
Brian