Just a day after convincing traders that all is well, vis-a-vis a move to the highest close since October of last year, the S&P 500 threw investors a curveball by falling 0.81% on Tuesday. Volume was minimal, and profit-taking was likely, so no need to sweat yet. But, it’s the kind of action that causes hesitation.
 United States Steel (NYSE:X) did the most damage, falling 10% after Credit Suisse analyst Curt Woodworth predicted a steel “sheet tsunami” was brewing that could catch the company with too much inventory against a backdrop of not enough demand. Novartis (NYSE:NVS) lost even more ground though, tumbling more than 12% on the heels of news that it would be spinning off its Alcon unit.
There were some winners. Levi Strauss (NYSE:LEVI), for instance, advanced 2.7% in response to a solid quarterly report (the first since the company IPO’d) that suggests the company is indeed ready to stand on its own. There just weren’t enough names like Levi to lift the whole market out of the red.
Headed into hump-day’s trading action, the stock charts of LyondellBasell Industries (NYSE:LYB), FMC Corp (NYSE:FMC) and Incyte (NASDAQ:INCY) are shaping up as your top trading prospects. Here’s why, and what has to happen next.
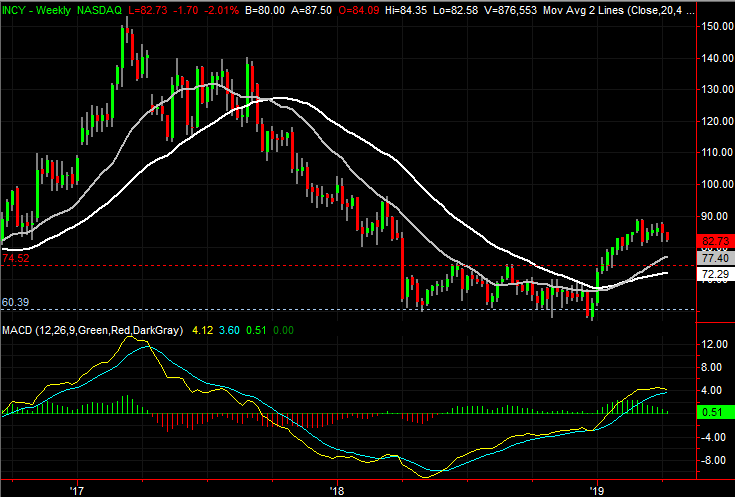
Incyte (INCY)
In late February, Incyte was examined — again — following a key bullish cross of its 50-day and 200-day moving average lines. Although overbought/overextended at the time, that moving average crossover was another clue that a bigger-picture uptrend was firmly taking shape.
The rally effort stopped shortly thereafter, but didn’t necessarily turn into trouble. As of Tuesday, though, one more misstep could kick-start a wave of trouble that wouldn’t necessarily have to undo all the work done since January, but could certainly prove stressful to investors who stepped into Incyte for the long haul.
Click to Enlarge
• You’ll also notice Incyte stock has already fallen under its purple 50-day moving average line, and done so on a fair amount of volume.
• Any of the prior ceilings like the one around $70 or near $74.70 could turn into floors, as could the gray 100-day or white 200-day moving average lines. Don’t assume a little weakness has to turn into a full-blown meltdown.
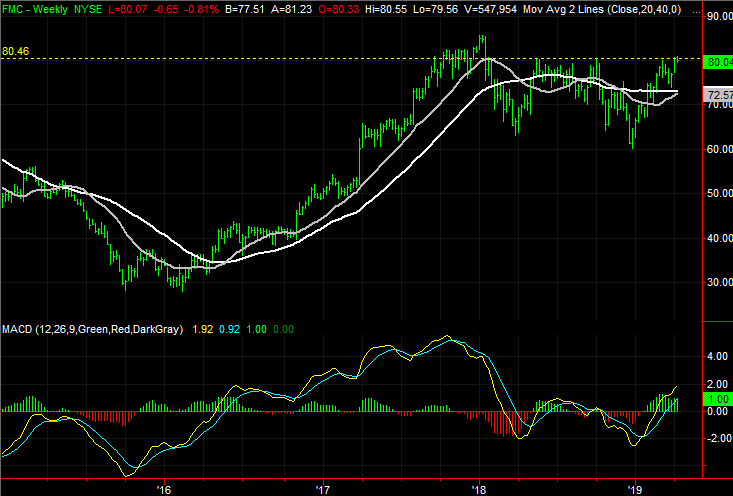
FMC Corp (FMC)
It was down yesterday, to the tune of 0.8%, but that could have been mostly expected from FMC Corp. Shares were not only up a frothy 30% from their December low, they bumped into a familiar technical ceiling.
It’s far too soon to close the books on the breakout attempt, however. Given the backdrop, the stock may only need to take a breather, regroup and try again before punching through.
Click to Enlarge
• Although it failed to hurdle that big resistance line with this effort, notice we have a so-called “golden cross,” where the purple 50-day moving average line has moved back above the white 200-day moving average.
• The depth of any preparatory pullback will ultimately depend on when, or if, the 50-day moving average line or the blue 20-day line act as support.
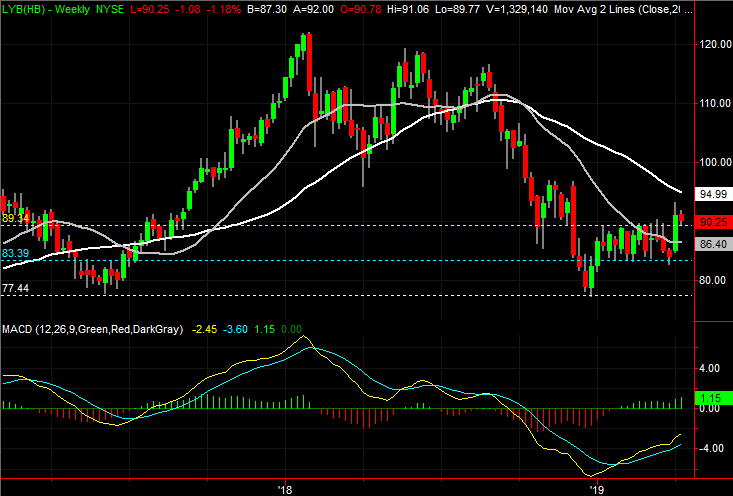
LyondellBasell Industries (LYB)
Back on March 7, LyondellBasell Industries was run through the technical trading wringer, with an emphasis being placed on the fact that it was trapped in a horizontal range between $89.56 and $83.60. LYB shares remained range-bound for several more days. Indeed, despite testing the upper edge of the range at the time, they ended up sliding back to the lower floor by late March.
That’s when things took a dramatic turn for the better though. Pushing up and off that support level, LyondellBasell was able to blast past $89.56 early this month. It was a move built all wrong though, with a gap being left behind in the process.
That gap was filled in yesterday, making today a pivotal day for the bulls and the stock’s prospects for a renewed breakout move.
Click to Enlarge
• Still, there’s a gap also from late March that has also not been filled in. It may not have to be though, if the bulls can make a convincing-enough statement from here.
• Such a statement may be easier to muster than it seems on the surface. Though down yesterday, volume was practically nil. Bearishness isn’t the majority opinion here.
• It’s easy to lose sight of this in all the volatility, but just within the past few days the blue 20-day moving average and the purple 50-day average line have both crossed above the gray 100-day average for the first time since the middle of last year.
As of this writing, James Brumley did not hold a position in any of the aforementioned securities. You can learn more about James at his site, jamesbrumley.com, or follow him on Twitter, at @jbrumley.