While the broader U.S. stock market had a sharp rally in its own right year-to-date, some stocks have literally pushed their charts into parabolic territory. One such name is burrito shop Chipotle (NYSE:CMG) which, thanks to the sharp move, is now tickling its previous all-time highs. For the near term, the stock is now dramatically overbought through the lens of technical analysis and trading at rich multiples from a fundamental perspective. Active traders and investors may want to explore the short side of CMG stock for a trade.
As I always like to point out in my analysis, over the course of my career I have found that looking at trading and investing ideas in multiple time frames (as far as the charts are concerned) is of tremendous help as it provides necessary perspective.
Since the late 2018 lows, CMG stock rallied about 85% with little more along the way than a small breather here and there. This rally has now made it one of the best-performing stock in the S&P 500 for the first quarter of 2019. This alone was enough for me to take a closer look at the charts and see if there is a trading opportunity worth exploring.
CMG Stock Charts
Click to Enlarge
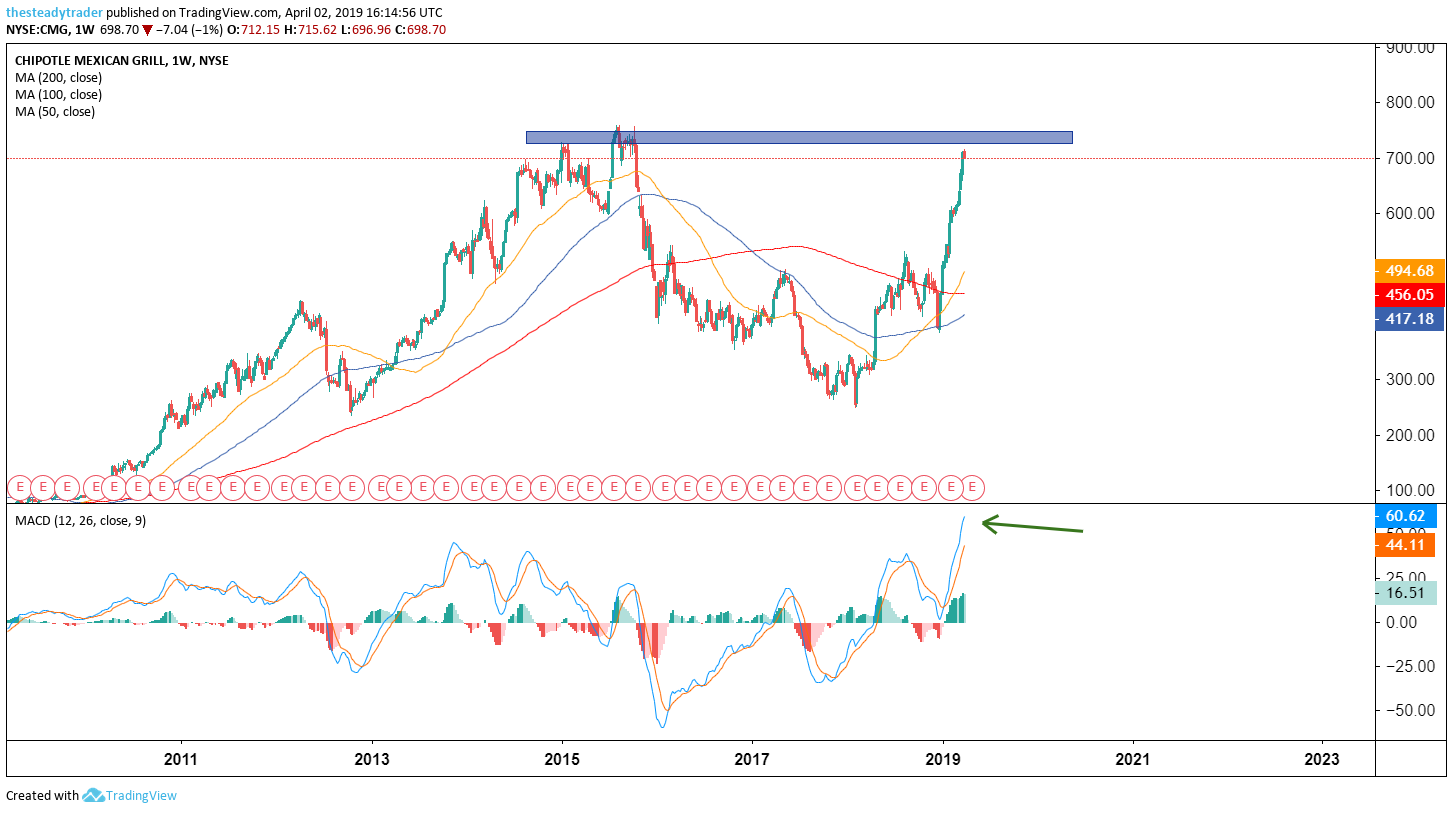
Moving averages legend: red – 200 week, blue – 100 week, yellow – 50 week
On the multiyear weekly chart, we see that the recent sharp rally, i.e off the late 2018 lows is just about unrivaled in the stock’s history in terms of the slope of the line. For those following momentum indicators it should thus be of no great surprise that the MACD oscillator at the bottom of this chart is now in record (as in all time) overbought on this weekly chart. While that does not mean the stock has to see an immediate retracement lower, it does put the odds of further upside at this rate at very low.
The last time the stock traded around these levels near $700 it was the second half of 2015 … i.e. the thus-far record highs in the stock.
Click to Enlarge
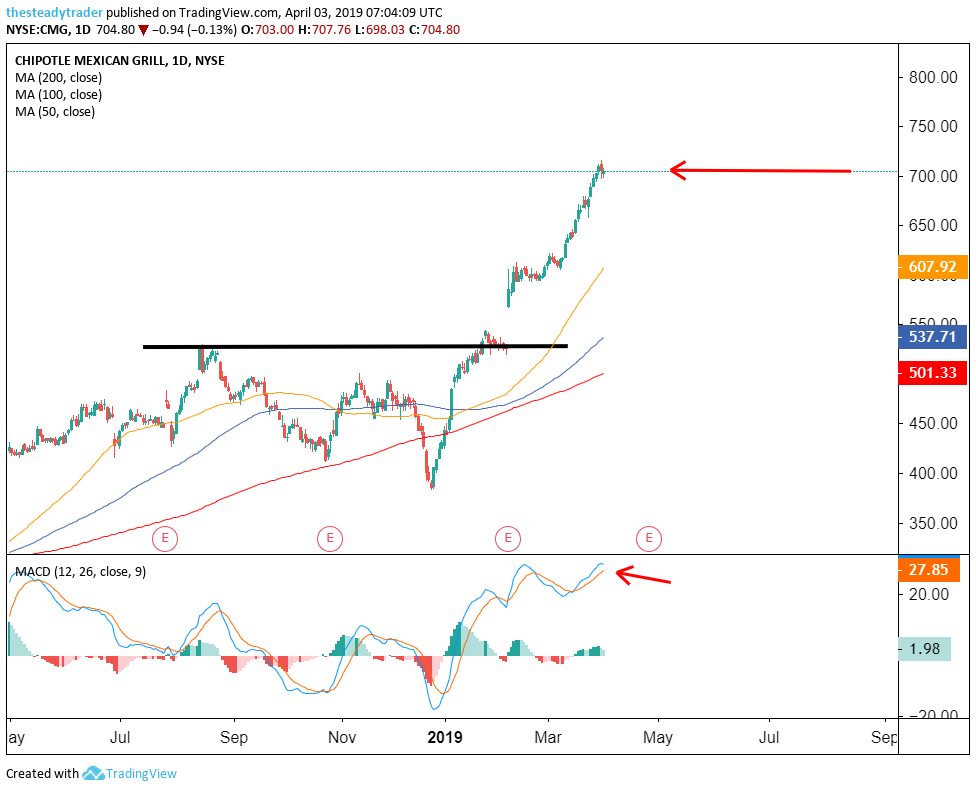
Moving averages legend: red – 200 day, blue – 100 day, yellow – 50 day
On the daily chart, we note that the steep rally in recent months only had a couple of relatively short consolidation periods, which is why the stock also in this time frame is trading in very lofty territory from a momentum perspective.
Active investors and traders thinking that the stock here, near previous all-time highs and in record ever overbought territory from a momentum perspective, will take a breather and mean-revert somewhat lower could look to play it from the short side.
Stock traders could short the stock around the $700 area with a first downside target at $640 and a stop loss at $750. Directional options traders may consider buying a May $700-$650 bear put spread.
Get FREE ACCESS to Serge’s renowned Stock Market Scanner with actionable trade ideas. Get it HERE.