The bulls finally started fighting back late in the day, but it didn’t matter. Even coming up off the intraday day low of 2,805.49, the S&P 500’s close of 2,822.24 was still 1.19% worse than Wednesday’s last trade.

Bank of America (NYSE:BAC) inflicted the most net damage, falling 2.5% for no particular reason other than it’s a high-profile name that could easily fold if investors continue to broadly see stocks as liabilities. Advanced Micro Devices (NASDAQ:AMD) technically lost more ground though, off 3.8% simply by being a top tech name. Technology stocks are being seen as the most vulnerable group as trade tensions between China and the United States escalate.
There were some winners, believe it or not, though not many. Top among that small group was L Brands (NYSE:LB). Shares of the parent company of Victoria’s Secret and Bath & Body Works rallied 12.8% in response to a surprisingly promising first-quarter report.
None of those tickers are promising trade prospects headed into Friday’s action though … too volatile to be predictable. Take a look at the stock charts of Moody’s (NYSE:MCO), Comcast (NASDAQ:CMCSA) and Alaska Air Group (NYSE:ALK) instead. Here’s why.
Alaska Air Group (ALK)
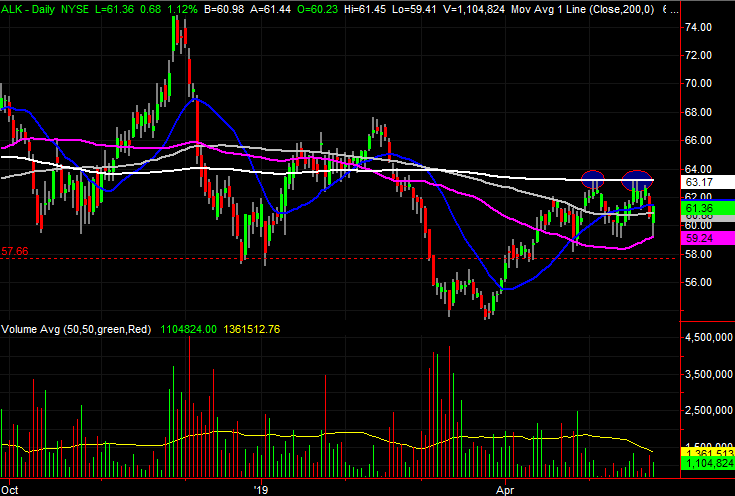
Alaska Air Group shares have been all over the place since the middle of last year. While the 2017 and early 2018 selloff has been quelled, several recovery efforts in the meantime have also been quelled. In fact, ALK slipped to new 52-week lows in March, teasing of another prolonged downtrend.
That disaster has so far been avoided, but Alaska Air is hardly back in an uptrend. Thanks to yesterday’s action though — and specifically, the placement of yesterday’s bar — this is a name to put back on your radar.
Click to Enlarge
- The big clue from Thursday is the way the stock pushed up and off of the purple 50-day moving average line to turn a loss into a gain (on a day the market was getting hammered, no less).
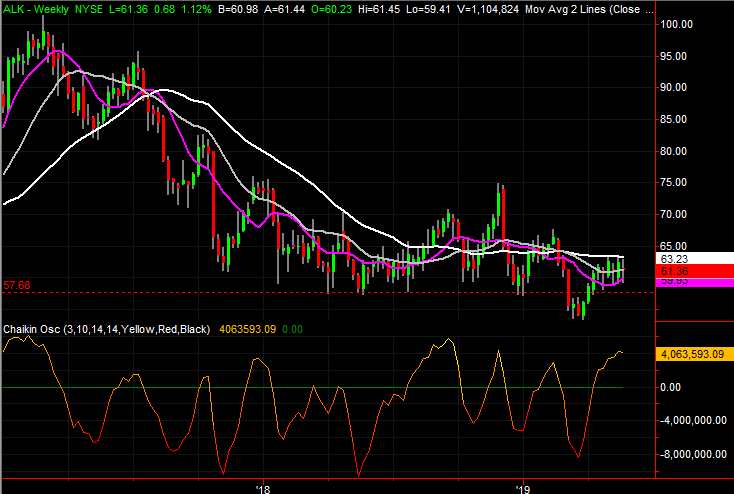
- The next big line in the sand is the 200-day moving average line, plotted in white on both stock charts. And it is a biggie, acting as resistance a couple of times already this month.
- Although prior rally efforts have all failed rather early on, the fact that the bulls keep swinging is telling in and of itself.
Moody’s (MCO)
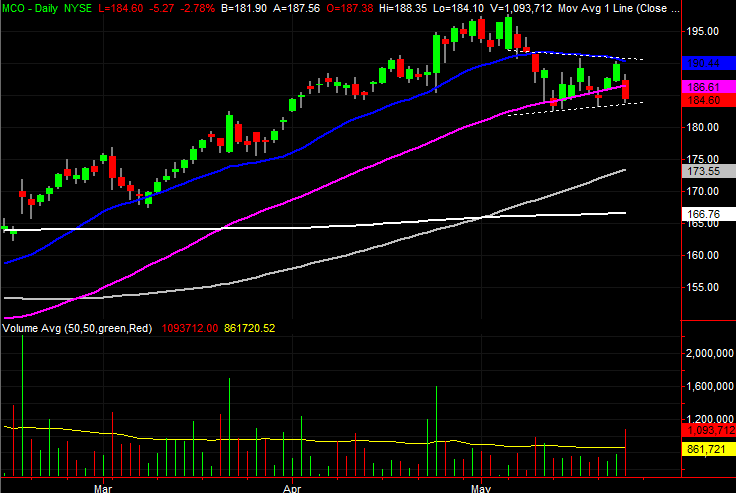
The past couple of weeks haven’t just been unusually volatile for Moody’s. They’ve been volatile in an unusual way. The swings have been rather extreme, not just big changes in the day-to-day closes, but entire low-to-high ranges that haven’t overlapped much with the prior day’s range. That’s often a sign of more indecision than it seems there is on the surface.
That indecision appears to have finally resulted in something of a death blow yesterday, although there’s still one narrow escape path the bulls could take if they’re willing to stick together.
Click to Enlarge
- That ‘death blow’ is the break below the purple 50-day moving average line, underscored by the fact that MCO shares still managed to start the day above that mark.
- It’s only modestly meaningful given its young age, but the lower edge of the trading range plotted with white dashed lines on the daily chart is still holding up as support.
- While that near-term support line remains intact, notice how much selling volume came pouring out of the woodwork on Thursday when the trouble solidified.
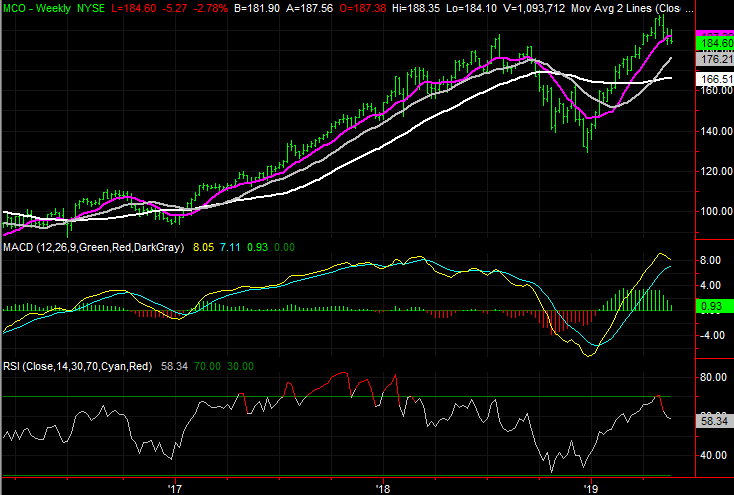
- Zooming out to the weekly chart it becomes clear that Moody’s overextended itself early in the year and is now ripe for some profit-taking.
Comcast (CMCSA)
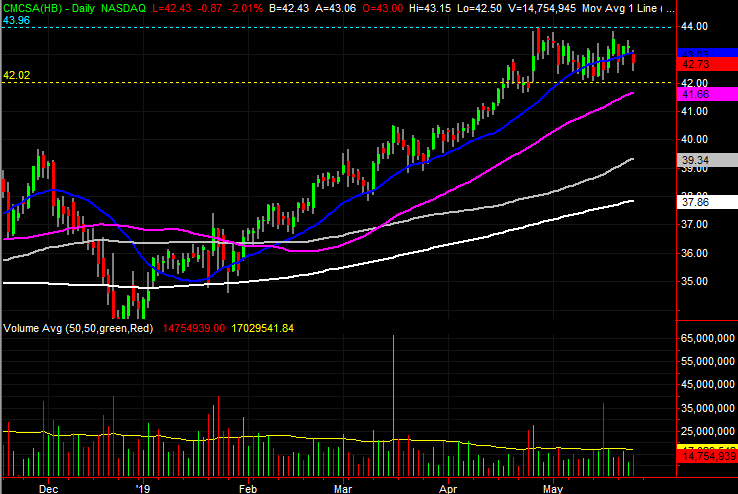
Finally, it may not have fallen off the edge of the cliff just yet, but Comcast shares have defined exactly where that edge is. And, they did so right after touching what was the most logical place for the stock to make a major peak.
If the bears can just get one or two more licks in, the already vulnerable CMCSA chart could topple in a big way.
Click to Enlarge
- The make-or-break level is right above $42, where Comcast shares found a bottom for a few days a couple of weeks back. The floor is marked with a yellow line on the daily chart.
- In the meantime, the purple 50-day moving average line has moved into position to either serve as, or fail to act as, a technical floor right around that same level.
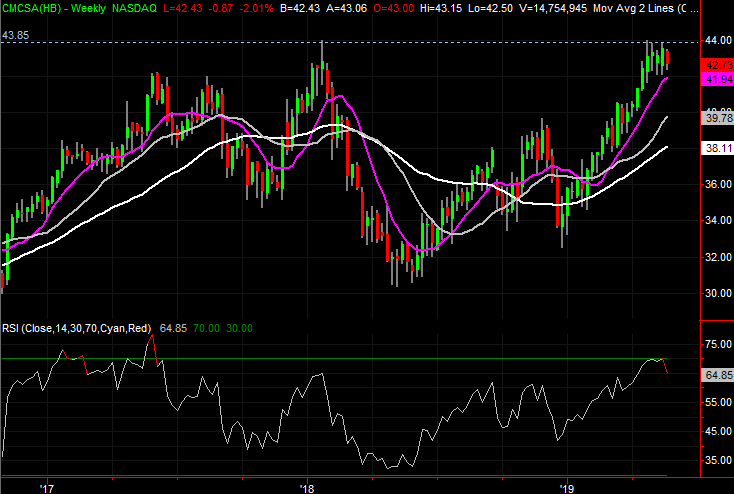
- Backing out to the weekly chart it’s clear that revisiting the early 2018 high around $43.85 presented some sort of psychological problem for the rally … not that CMCSA wasn’t overbought as of last month anyway.
As of this writing, James Brumley did not hold a position in any of the aforementioned securities. You can learn more about James at his site, jamesbrumley.com, or follow him on Twitter, at @jbrumley.