The bulls tried to stop the bleeding before it started in earnest, but by the time Wednesday’s closing bell rang, the gain turned into a loss. The S&P 500 ended the session off to the tune of 0.12%. Curiously, however, there were more winners than losers on Wednesday, and more bullish volume than bearish volume.

BlackBerry (NYSE:BB) wasn’t one of the winners, falling nearly 9% following an earnings report that was technically a beat, but weak on the one front where the company needed to shine.
On the flipside, Micron Technology (NASDAQ:MU) and Overstock (NASDAQ:OSTK) kept the day’s losses well-contained. Micron shares were up 13% following a promising quarterly earnings report that hinted of recovering memory prices. Overstock, meanwhile, rallied 25% on perceived progress towards the eventual sale of its e-commerce arm to a third party that will let the existing company focus entirely on blockchain.
None are worthy trades as Thursday’s action gets going, however. Rather, it’s the stock charts of H & R Block (NYSE:HRB), Boeing (NYSE:BA) and Eli Lilly (NYSE:LLY) that are worth a closer look. Here’s why.
Eli Lilly (LLY)
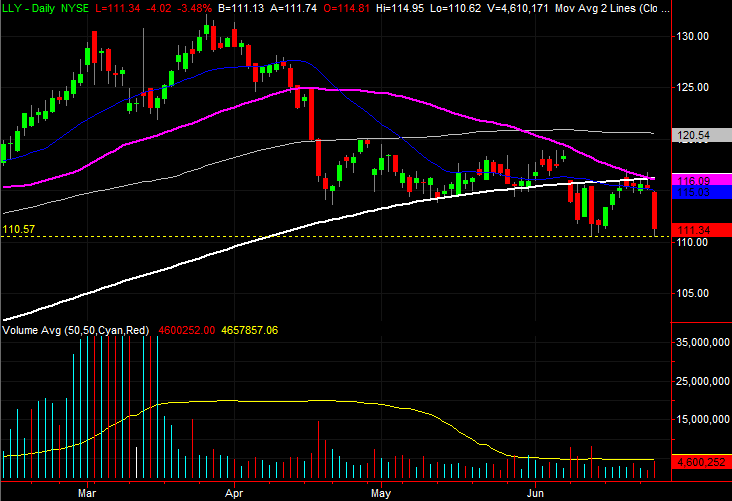
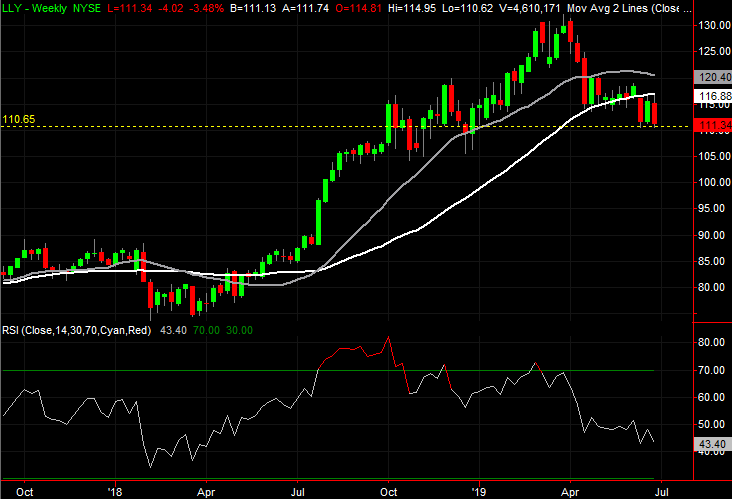
All throughout the month of May, Eli Lilly shares found support at the 200-day moving average line, plotted in white on both stock charts. In fact, even late in the month and early this month, shares were pushing up and off that floor, hinting at a recovery move.
That effort came crashing down earlier this month with a big plunge under the 200-day line. The bulls even had their chance to repair the damage. The former floor has turned into a ceiling though, up-ending the bounce effort. As of yesterday, Lilly is hanging by a thread.
Click to Enlarge
- The last bastion of hope is right around $110.60, marked in yellow on both stock charts. That was Wednesday’s low, as well as the low made with the early June stumble.
- The bulls tried to rebound a couple of weeks back, but the purple 50-day and white 200-day moving average line turned into a technical ceiling.
- As of yesterday, the 50-day moving average line has broken below the 200-day line … a so-called “death cross” that says the bearish momentum has been fully developed.
H & R Block (HRB)
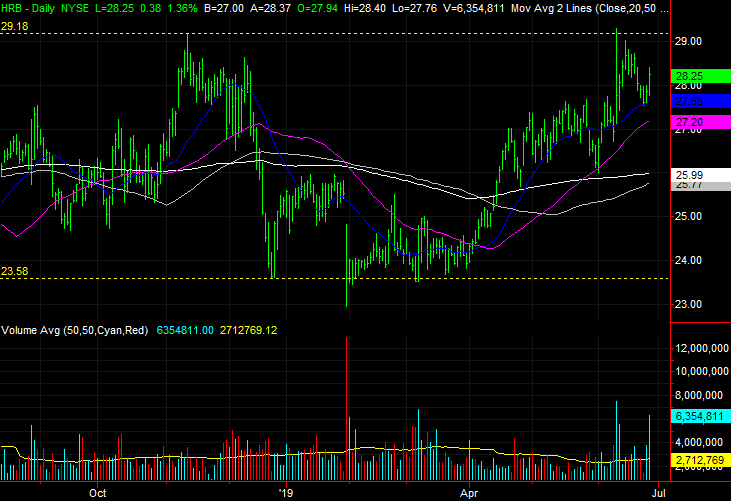
Just a few months ago, H & R Block shares were on the brink of a major collapse. Just earlier this month, HRB stock was testing the waters of a breakout move.
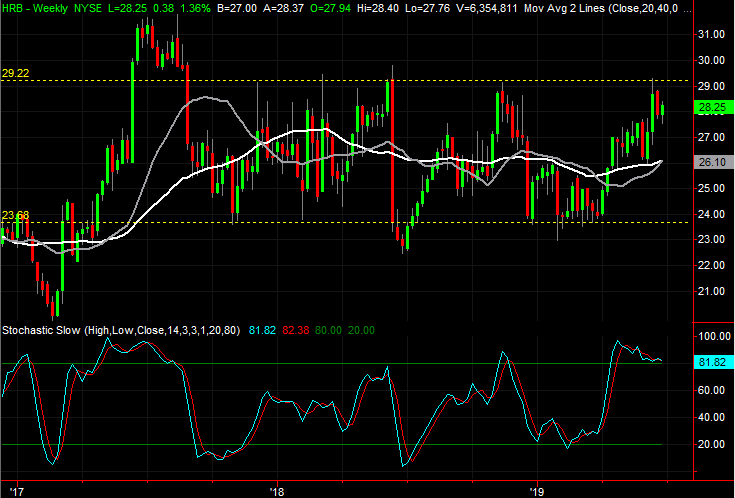
The beginning — and end — of that rebound effort further solidifies a trading range that has been in place since late-2017. While the odds favor more of the same range-bound action that will sooner than later drag H & R Block to the lower boundary of the range. But, there’s one compelling clue that suggests a breakout may be in the works. With a couple of years’ worth of consolidation in the rearview mirror, the right step forward could prove catalytic.
Click to Enlarge
- The technical ceiling to watch is around $29, where H & R Block shares have peaked multiple times since late 2017.
- Although HRB has been in this situation before, to no avail, the past couple of weeks have seen a massive degree of bullish volume put a second wind in place.
- Conversely, if H & R Block fails to break past the $29 level with this second effort, a pullback to the $23.60 area — again — becomes all the more likely.
Boeing (BA)
At the very beginning of the year, shares of planemaker Boeing were flying high. It all unraveled in early March, however, following a second crash of its much-touted 737 MAX that may have put the plane’s (and the company’s) future in jeopardy. By May, BA stock was under its 200-day moving average line, and seemingly positioned to continue falling.
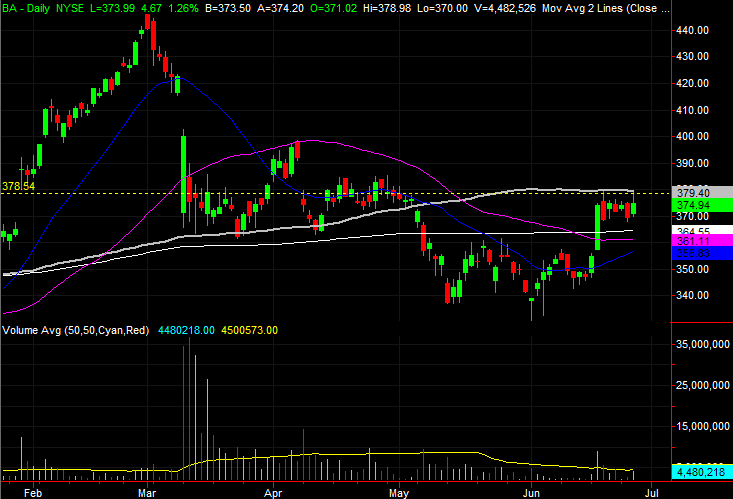
Much has changed in the meantime. Not only are Boeing shares back above the important 200-day moving average line plotted in white on both stock charts, they’re knocking on the door of a major technical ceiling that could portend a complete recovery of what’s been lost since February’s peak.
- The technical resistance is the grey 100-day moving average line around $379.40, although there’s a horizontal ceiling just below that mark that’s taken shape since late last week.
- Although it started the February pullback after an unusually strong runup, the speed of the selloff left it stochastically oversold and ripe for an equally big rebound.
- And though a move above $379.40 is the key, the confirming clue in this case would be a completion of the bullish MACD cross that’s starting to take shape.
As of this writing, James Brumley did not hold a position in any of the aforementioned securities. You can learn more about him at his website jamesbrumley.com, or follow him on Twitter, at @jbrumley.