Following it’s latest earnings report this week rallied, shares of cloud-based website development platform Wix (NASDAQ:WIX) rallied, taking its year-to-date gains to nearly 70%. While trend followers and chart chasers alike have enjoyed and profited from this move, in my eye, WIX stock is getting morbidly overbought. The currently ominous bearish technical pattern may soon come home to roost and for the bears to profit from.

Yes, we are in the midst of corporate earnings season and opportunities for traders and investors alike are abound. However, given all of this opportunity, it is easy to get caught up in emotions and leave out the bigger picture analysis for an immediate-gratification trade setup. The charts of WIX.com currently have that “bull trap” look to them.
WIX Stock Charts
Click to Enlarge
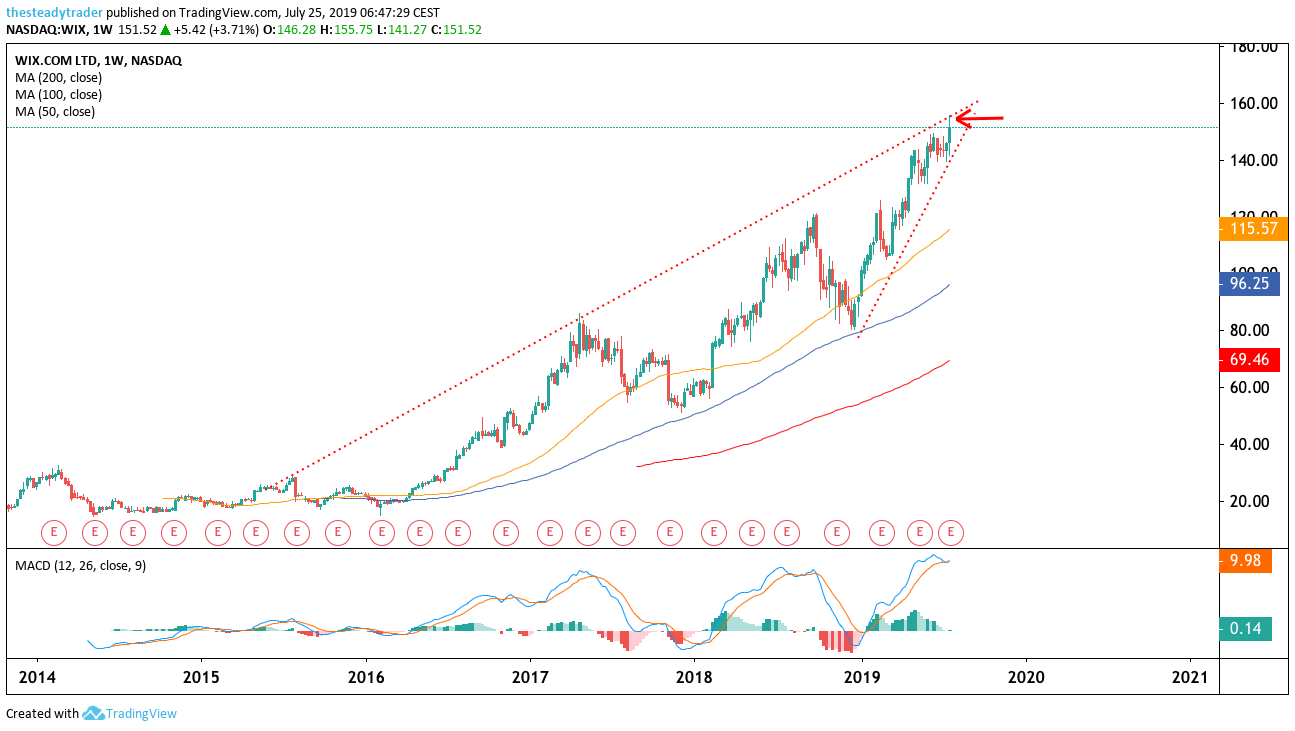
Starting off with the bigger picture multi-year look, we see that over the past few years, WIX stock has been in a clearly defined up-trend that rewarded the astute trend followers. While I do consider trend-following to be a great strategy, it must be applied properly or it can bite badly.
At the very core of trend-following lies the concept of buying at the lower-end of the trading range and selling or taking partial profits at the top-end of said range.
Looking at this multi-year chart, we can see that WIX stock clearly resides at the very upper-end of the trend. This is not to say that the stock cannot squeeze somewhat higher, but rather, that the history of the chart clearly indicates that upside is limited.
While we can add annotations of all sorts to this chart, I see a bearish rising wedge pattern as marked by the two red-dotted lines. Since this rising wedge pattern lines up with the top-end of the longer-standing bull trend, it further emphasizes my point, not to mention that the MACD momentum oscillator at the bottom of the chart is record overbought.
Click to Enlarge
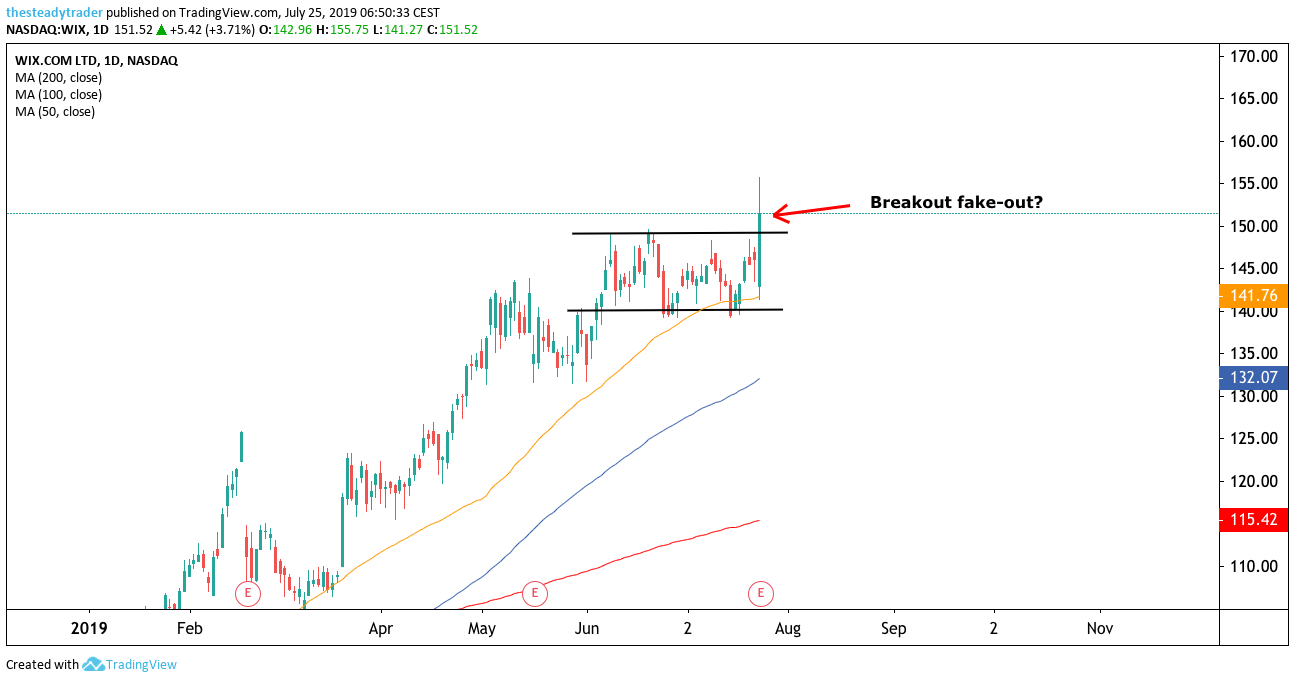
On the daily chart, we see that following this week’s earnings report, WIX stock broke out of a multi-week sideways pattern on July 24, all the while bouncing off the yellow 50-day simple moving average. From an immediate-term perspective this is all very constructive and indeed the stock could see a somewhat further upside squeeze for a quick trade.
Through a multi-week and multi-month lens, however, I suspect that the bigger picture overhead resistance will ultimately show the path of least resistance for WIX stock to be lower and back toward the $130’s.
Active investors and traders could look to short WIX stock upon the next meaningful bearish reversal, where the stock either has a notable down day of at least 2%, or the stock gives up all of its intraday gains upon a failed intraday rally attempt. The next downside target would then become $135 and any strong bullish reversal would be a stop loss signal.
Myself and my clients prefer to structure a trade in a manner that reaches the highest probability, which, in this case, means selling a very specific options spread.
In order to teach this special options trade, I am holding a webinar for InvestorPlace readers on Thursday, July 25. Register here.
Join Serge in an exclusive live webinar: The steady income options strategy. Register HERE. As of this writing, he did not hold a position in any of the aforementioned securities.