The S&P 500, as represented by the popular exchange-traded fund the SPDR S&P 500 ETF (NYSEARCA:SPY), has embarked on a slippery slope lower over the past couple of weeks. For active investors this is a time where it pays to be tactical and measure downside targets one day at a time. I still like being short the SPY ETF from a trading perspective and below I lay out my case for the next downside levels this ETF could possibly reach.

When I first offered the trade idea to short the S&P 500 on Aug. 1, the recent selling pressure had just begun. In the meantime, the proposed first downside target of the trade idea around $288 in the SPY ETF has been reached. Furthermore, the index has found some time to consolidate and over the past day or so and it now looks to have begun making its next leg lower.
Thus it’s time to look at this trade idea again for what the next downside targets could be.
SPY ETF Charts
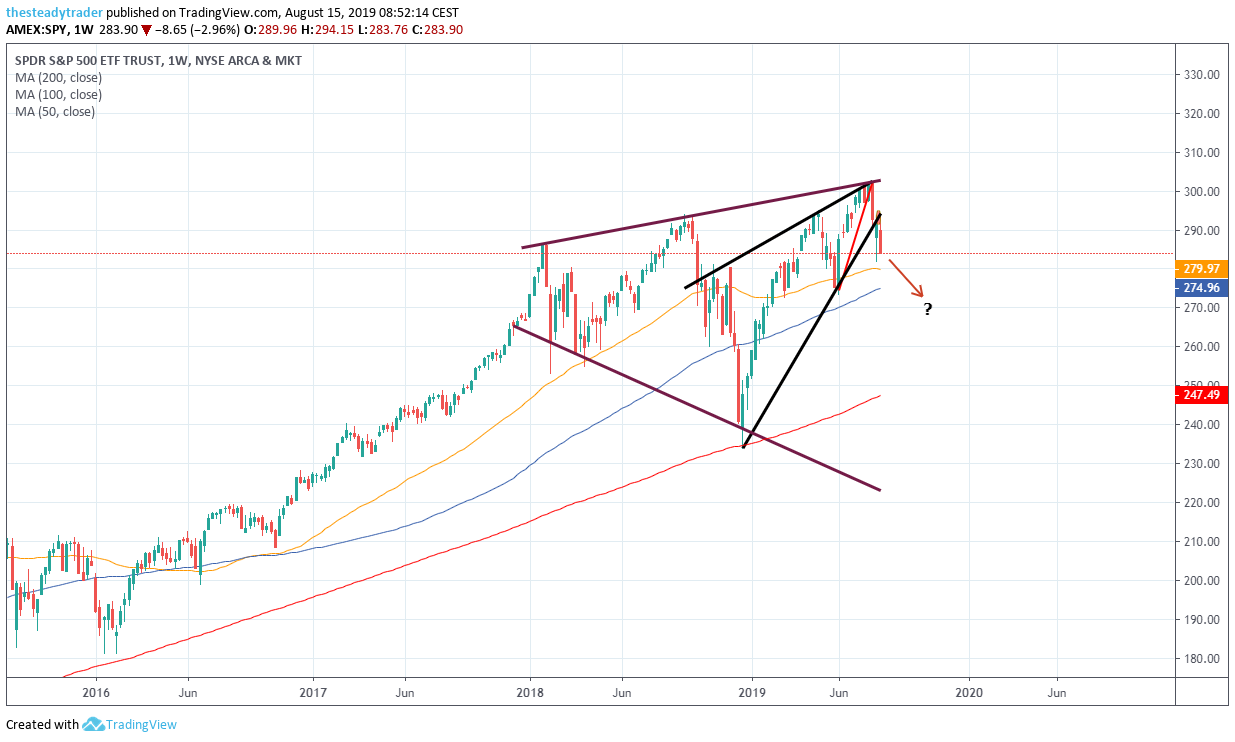
First, on the bigger picture chart note that the upper-end of our “megaphone pattern” (purple lines) has indeed offered resistance for stocks. The popular S&P 500 ETF then subsequently first broke below the steepest rising wedge pattern (red line), followed by the next and larger rising wedge pattern (black lines).
As we want to take this day-by-day, week-by-week and month-by-month, I don’t yet want to focus on the potential much lower target at the bottom of the megaphone pattern, or at least around the late December 2018 lows … although that ultimately is a downside target worth keeping in mind.
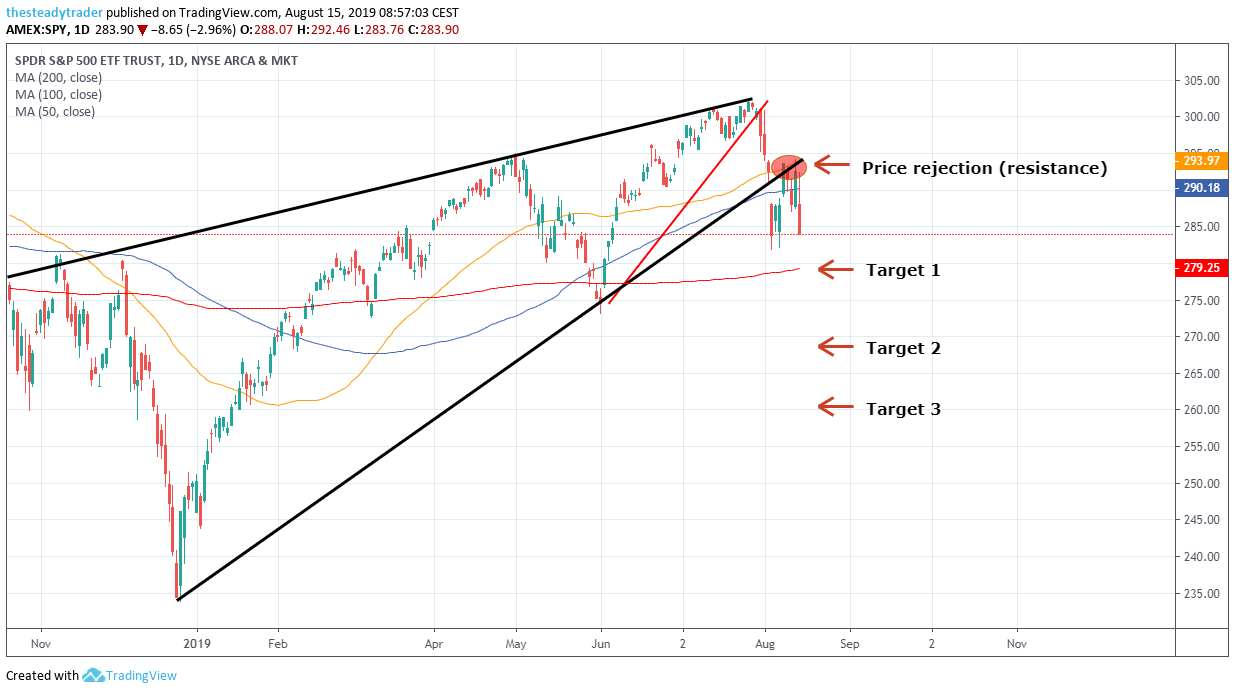
On the daily chart we see that from Aug. 8 to Aug. 13 an important price area around the $293 – $294 zone offered critical technical resistance for the SPY ETF. It so happens that this area also coincided with the yellow 50-day simple moving average, as well as a 50% retracement of the first leg lower from late July into early August. With the selling pressure from Aug. 14, the SPY ETF now looks to have embarked on the next leg lower that could see the red 200-day simple moving average as a first downside target, around the $280 area.
While the second and possibly third downside target could take some time to reach (if and when), here they are:
- The second price target is around $269, which is the 50% retracement of the entire 2019 stock market rally
- The third price target is around $260, which is the 61.80% Fibonacci retracement of the entire 2019 stock market rally
My clients and I prefer to structure a trade in the highest probability manner, which, in this case, means selling a very specific options spread on the SPY ETF.
In order to teach this special options trade I am holding a webinar for InvestorPlace readers on Thursday, Aug. 15. Register here.
Join Serge in an exclusive live webinar: The steady income options strategy. Register HERE.