Small-cap stocks, as represented by the iShares Russell 2000 ETF(NYSEARCA:IWM), much like the rest of risk assets, tumbled or “mean-reverted” over the past few trading sessions. Although in the immediate term they’re somewhat oversold, through the September/October period, I could see plenty more downside for the IWM ETF that bears could take advantage of.

Last week on Aug. 1, I offered the idea to short the S&P 500 via the SPDR S&P 500 ETF (NYSEARCA:SPY). This trade has done well so far and some near-term profit taking is likely in order. Personally, I am now preparing to switch my SPY short into a short position in the Russell 2000 ETF for the reasons laid out below.
IWM ETF Charts
Click to Enlarge
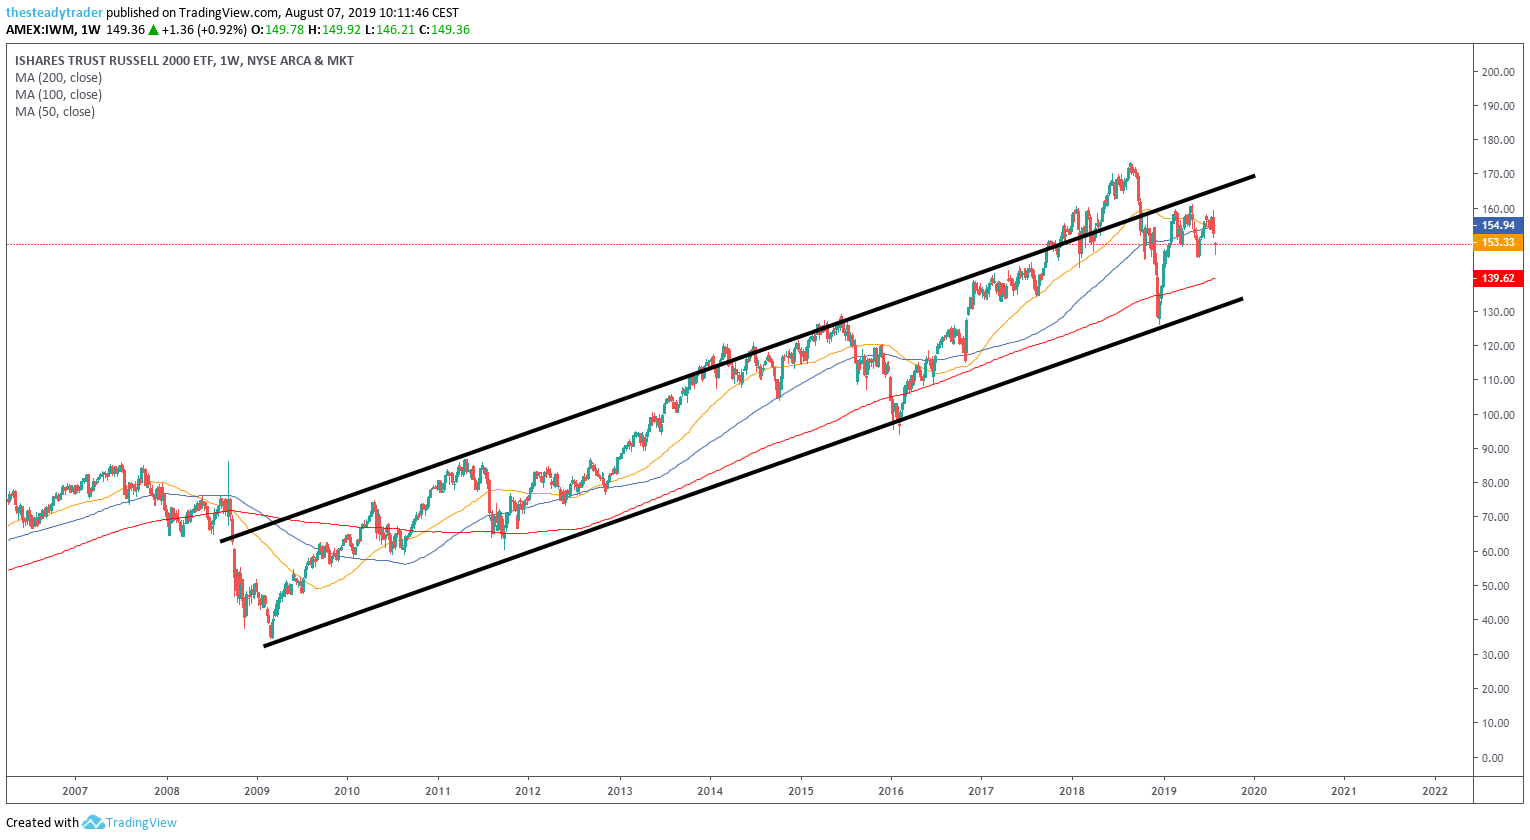
Firstly, looking at the multi-year chart with weekly increments is crucial to gain proper perspective where any given asset is trading in the bigger picture.
On this chart, we see that for the most part, the IWM ETF through the past ten years ascended in a well-defined range. From November 2017 into September 2018, this index had several overshooting attempts out of this range; however, these proved to be short-lived as mean-reversion is a powerful reality in markets.
Indeed this overshooting then led to a sharp selloff in Q4 2018, as the IWM ETF traded all the way down to the lower end of the longer-standing uptrend.
In Q1 2019, the Russell 2000 ETF had a sharp rebound along with the broader market, which again pushed it to the upper end of said range. Since then, the choppy market favors another test of the lower end of range in the not too distant future.
Click to Enlarge
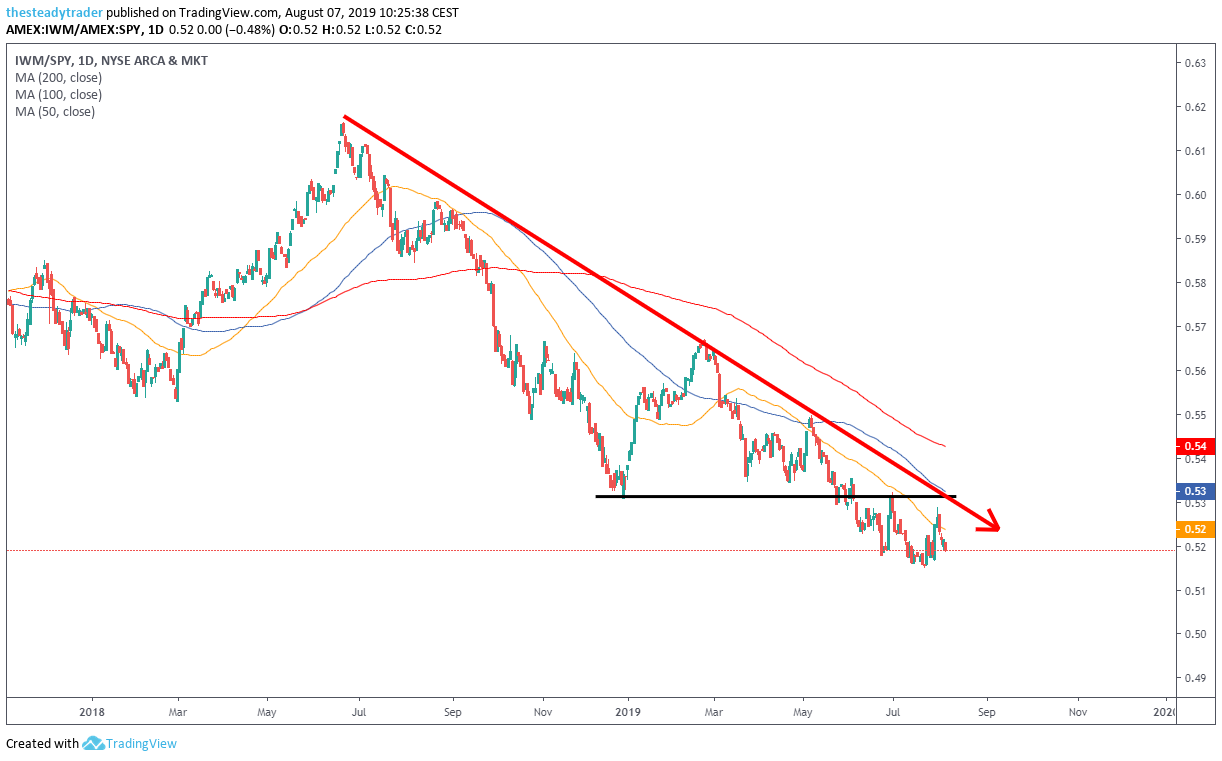
The relative chart — the ratio chart of the IWM ETF divided by the SPY ETF — shows the relentless relative weakness of small-cap stocks versus large-cap stocks since the summer of 2018 (for the past twelve months or so). This pervasive trend has yet to change … and in this case, “the trend is our friend.”
Click to Enlarge
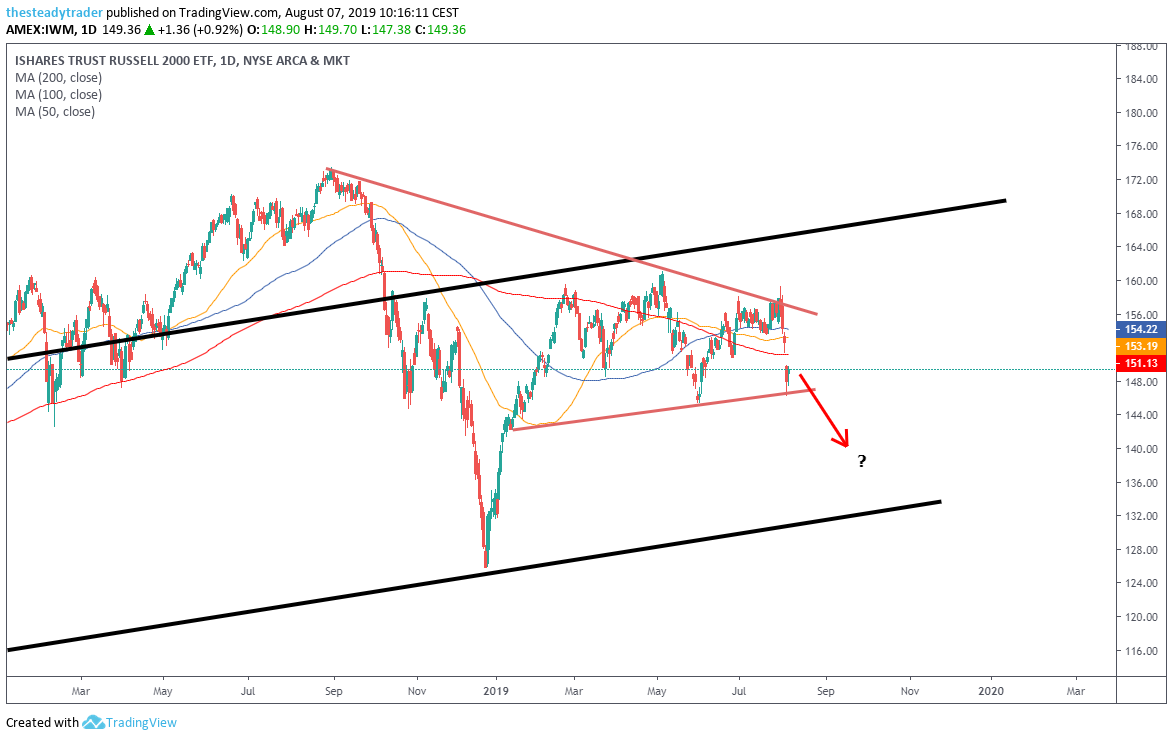
Lastly, on the daily chart, we see that another way to draw lines on the chart is by handicapping the March, present-day trading range (red lines).
The selling of recent days now has the IWM ETF at the lower end of this range but only in the middle of the bigger-picture range (black diagonals). If the broader market sees another leg lower in the coming weeks, which is my base case, then more downside toward the lower end of the big-picture range should also be in store for the Russell 2000.
As such, I suggest shorting the IWM ETF in the $150 – $152 area with a downside target of $135, and a stop loss at $157.
Get FREE ACCESS to Serge’s renowned Stock Market Scanner with actionable trade ideas. Get it HERE.