Editor’s Note: U.S. markets are closed all day on Wednesday, which is New Year’s Day.
Yesterday, the S&P 500 continued to pull back from its recent high. Because there is a chance the index could make another move to the downside, I’m recommending a downside insurance trade on the SPDR S&P 500 ETF (NYSEARCA:SPY).
The market has been in a bullish mode, and last week my indicators gave bullish readings. The S&P 500 has soared since it broke above the 3,000 level in late October, but as you can see in the chart below, it finally pulled back yesterday.
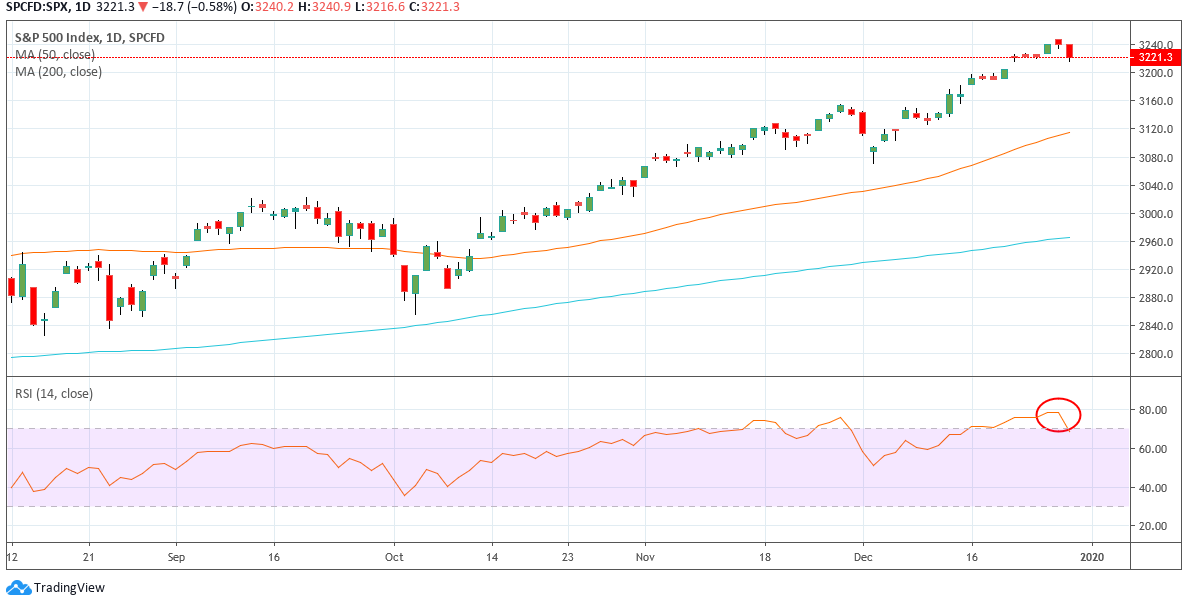
Daily Chart of S&P 500 Index — Chart Source: TradingView
It’s possible the index was overextended. In the bottom panel of the chart you can see the relative strength indicator (RSI) for the index. Last Friday, the RSI was hovering around 78, which is “overbought” territory.
Overbought and Oversold
As my regular readers know, traders often use indicators such as the RSI to determine whether a stock or index is in “overbought” or “oversold” territory.
Typically, an RSI reading above 70 tells traders that an asset is overbought, or overvalued, while a reading below 30 tells traders that an asset is oversold, or undervalued.
The RSI reading last Friday was the the highest level we’ve seen all year. In fact, it’s the highest level we’ve seen since January 2018, which proceeded a 12% correction.
Being overbought doesn’t necessarily mean we are due for big drops in the market, but yesterday’s pullback wasn’t surprising.
After yesterday’s drop, the S&P 500’s RSI dropped to around 70. We could see the market fall a little more, but it isn’t sitting in overbought territory for now. With a bearish trade on SPY, we can be ready if there is another pullback.
A Cheap Way to Play
SPY is an exchange-traded fund (ETF) that tries to match the performance of the S&P 500. If you look at the chart below, you can see that SPY’s performance looks similar to the broader index. Because it follows the index so closely, it is a great target for a downside insurance options trade.
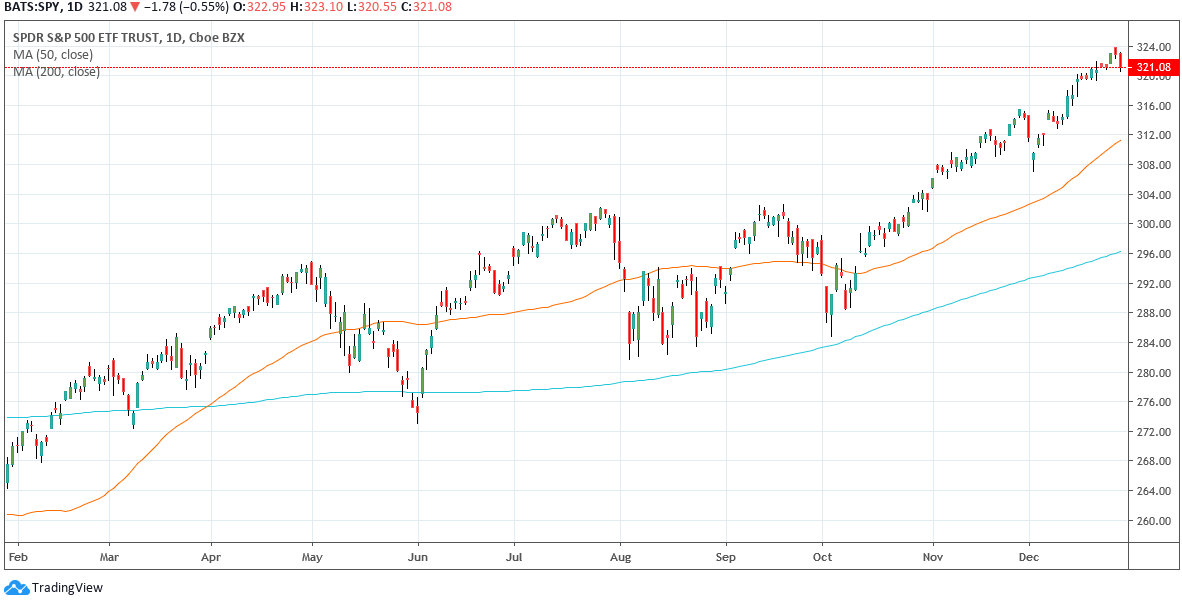
Daily Chart of the SPDR S&P 500 ETF (SPY) — Chart Source: TradingView
A good downside insurance trade needs to be inexpensive, which is one reason I usually recommend ratio debit spreads rather than regular debit spreads. In a ratio spread, you sell two options and buy one option.
Because you have one naked option, the risk is a little higher. However, when trading using an ETF as the underlying stock, you are limiting that risk.
ETFs don’t usually move as quickly as regular stocks. That slower movement should give you plenty of time to exit the position for a profit — before you risk being put shares because of your naked option.
With this ratio put debit spread, traders can add cheap downside insurance to their portfolios in case of another pullback.
Using a spread order, buy to open 1 SPY Jan. 22nd (2020) $317 put and sell to open 2 Jan. 22nd (2020) $308 puts for a net debit of about $0.20.
Note: Be sure you are opening the weekly SPY options that expire on Wednesday, Jan. 22, 2020.
This is a high-risk trade, so take a small position.
About Ratio Put Debit Spreads
A ratio debit spread is simply a way to lower the cost of buying options, as the two options that you sell to open (short) help offset the cost of the option that you buy to open. Therefore, this ratio put debit spread is a way to lower the cost of establishing a bearish put option trade. Many brokers will require the use of margin and/or a set amount of reserved capital to execute a ratio debit spread; contact your broker directly for specific requirements.
Because you are short a naked put in this ratio put debit spread, the risk is that you could be obligated to buy 100 shares of SPY at the $308 strike price for every 1 contract that you are short of the SPY Jan. 22nd (2020) $308 puts. So, this is inherently a higher risk play.
InvestorPlace advisor Ken Trester also brings you Power Options Weekly, which delivers 5 new options trades and his latest trading advice to you each Friday. Trester has been trading options since the first exchanges opened in 1973 with a winning streak that goes back to 1984 with money-doubling average annual profits since 1990.