Shares of banking giant JPMorgan (NYSE:JPM) traded lower on Tuesday following the company’s latest earnings report. A combination of fundamental and technical factors put the odds in favor of another push lower in JPM stock and one for active market participants to pounce on.


As with most companies that will report this earnings season, what JPMorgan had to say about their earnings wasn’t nearly as important as their outlook in this most uncertain time.
One of the most striking comments came from CEO Jamie Dimon (my former boss) as it related to credit card payments. He expects many people not to pay their credit card payments in the near future.
Furthermore, the government is asking big banks like JPMorgan to help stem the crisis by ‘taking a hit,’ as the government is indirectly telling the population not to pay their mortgage or credit cards for the time being.
To me, this combination of a still very murky economic outlook and expectation of consumers to not pay mortgages and credit card bills is a recipe for more volatility for JPM stock.
JPM Stock Charts
For some perspective, on the multi-year weekly chart we see that JPM stock, after overshooting the 10-year trend in late 2019, proceeded to drop to the lower end of trend. As I often say, mean-reversion in markets is one of the most powerful and profitable concepts if applied correctly.
The sharp bounce that the stock endured over the past couple of weeks, much a function of the broader market’s oversold readings, has pushed JPM stock back to short- to intermediate-term resistance levels that formerly acted as technical support.
Click to Enlarge
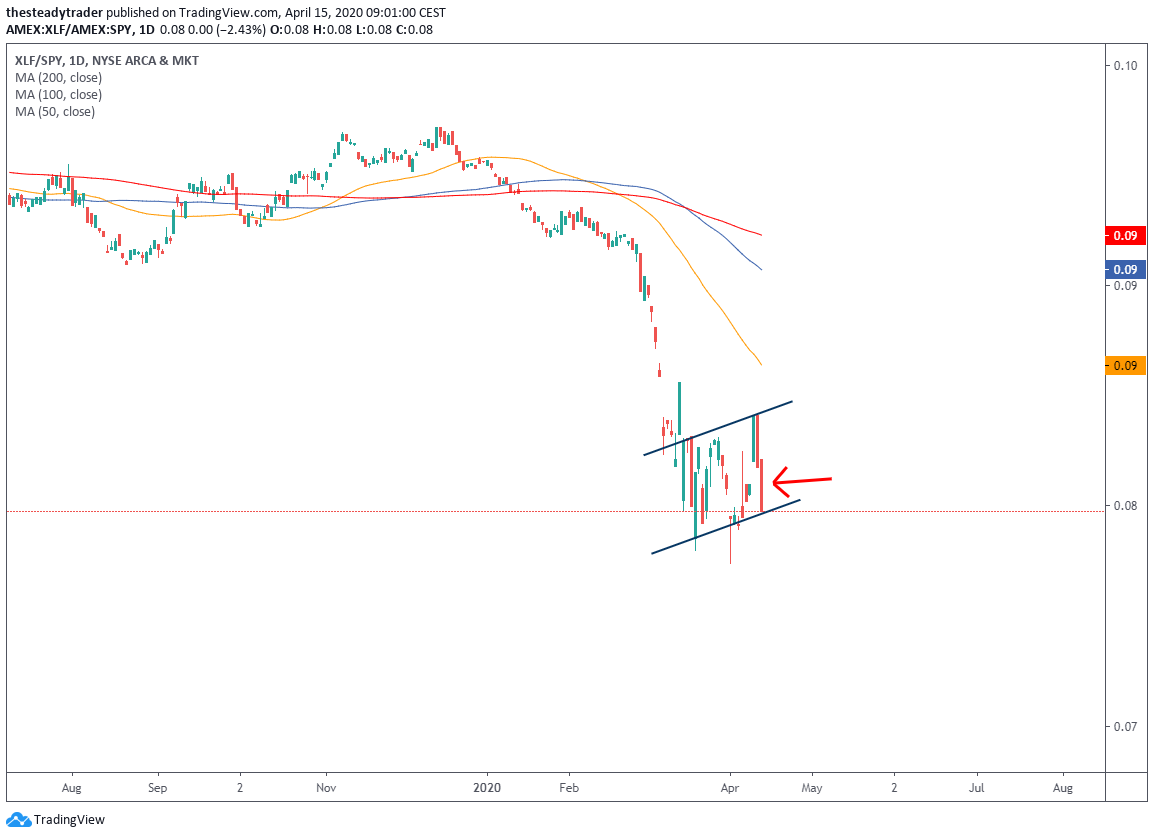
Before looking at the daily chart of JPM stock, note that on April 14 the financial sector of stocks in the S&P 500 not only exhibited absolute weakness, but in relative terms, had one of its worst days in many years (see chart on the right). This so called ‘ratio chart’ pushed to the lower end of its multi-week trading range in what technical analyst may refer to as a ‘bear flag pattern.’ Such a pattern would point to further relative weakness in financials versus the S&P 500.
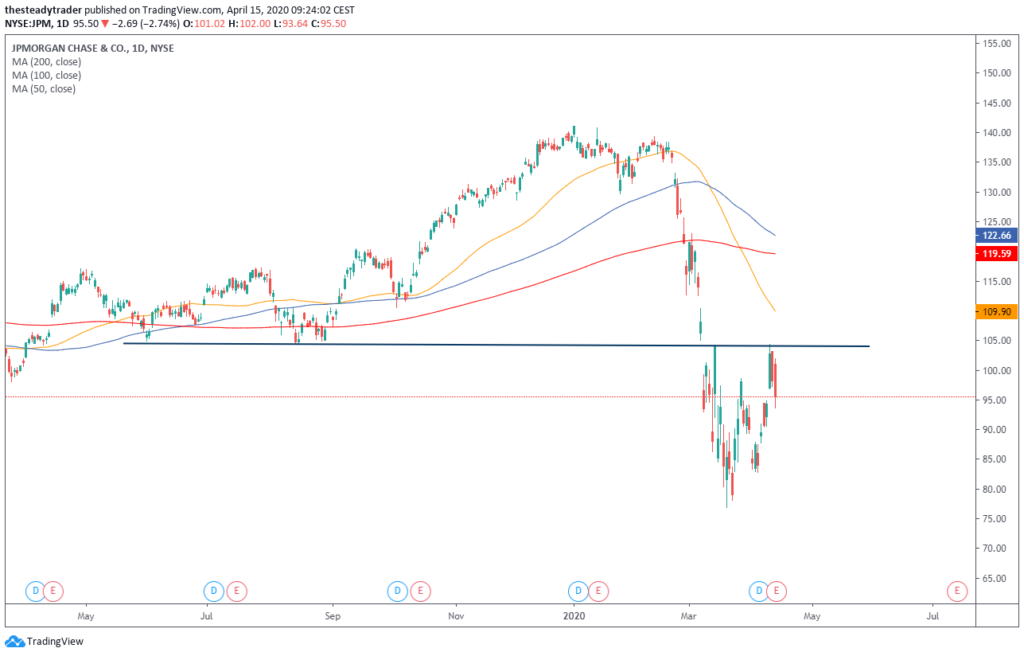
Lastly, on the daily chart we see that JPM stock earlier this week reached an area of confluence technical resistance around the $104 area, which it promptly rejected following the earnings report.
While the stock could bounce back-and-forth for a while, I see upside as limited and a next downside target in the stock around $88 as the most likely of outcomes in the near-term. Any push back above the $105 area, particularly on a daily closing basis, would be a stop loss signal.
Do you like high probability stock, ETF and options trades? Serge Berger sends them out for free daily. Sign up at www.thesteadytrader.com