GameStop (NYSE:GME) is not trading well after earnings. The company reported after the close on Dec. 8, with GME stock falling just over 10% the following day as a result.

On Friday, there was a chance for GameStop to undo some of the technical damage. However, the stock did not behave well as the markets chop around.
I know not everyone who reads financial articles is a technical-based investor or trader. However, those who blend the two analyses — technical and fundamental — or at least consider the technicals, should be aware of how the chart is currently setting up.
We’ll dish on the numbers in a minute, but let’s look at the charts first.
Trading GME Stock
Click to Enlarge
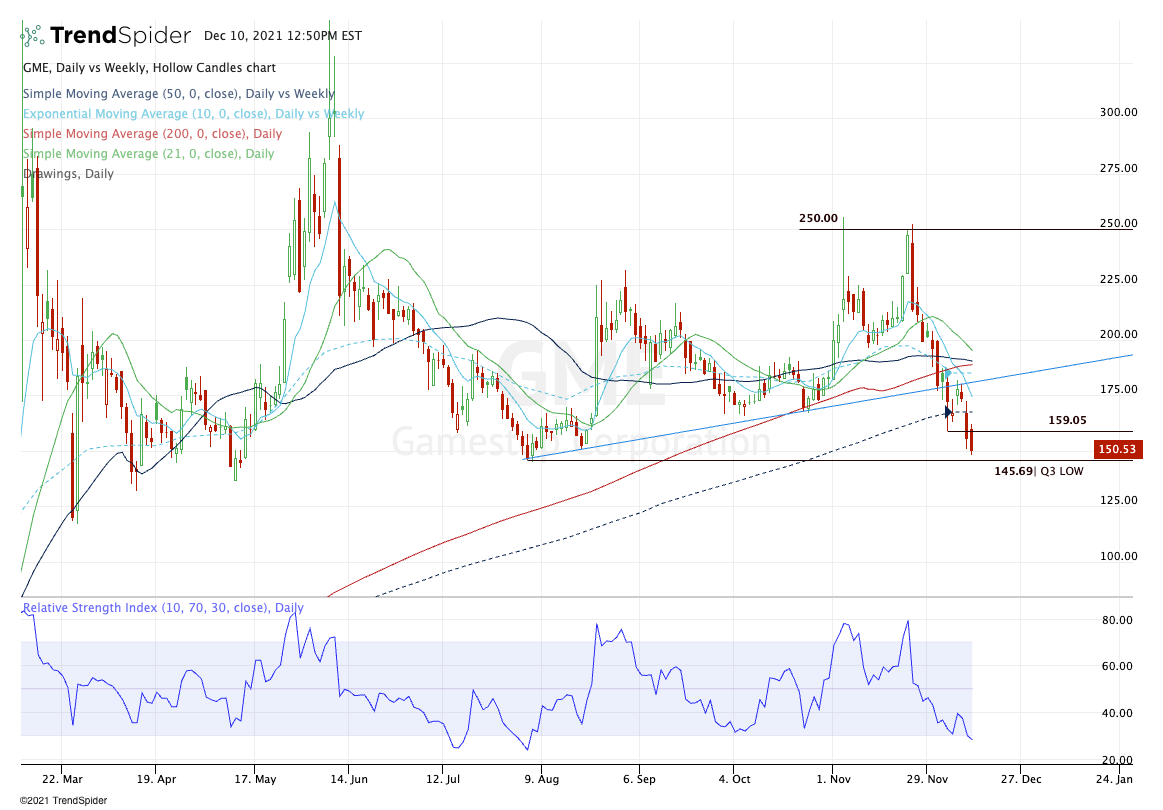
Overall, the look for GME stock is not good. Aside from its 10% tumble on earnings, GameStop was down more than 4% for most of Friday too.
The bigger problem is that shares went weekly-down below last week’s low near $159. Now if it could have reclaimed this level on Friday, it would have nullified some of that damage.
It didn’t reclaim this level, but boy did it come close.
On Dec. 10, GameStop was down 4% to 5% for most of the session. However, in the final hour, it ripped higher — ending the session higher by 2.1% and closing the week at $159.01. That’s four cents below last week’s low.
That leaves traders in a pretty tough position with GME stock. We’re not going to split hairs over a couple of pennies. So what we need to see is simple.
Below $159 leaves GameStop vulnerable to a further dip. Specifically, it has me watching the third-quarter low down at $145.22, which isn’t all that far away. Below that, and we could see further weakness into the mid-$130s.
If the selling pressure really picks up, you know there will be bears who have their sights set on the $100 level.
On the upside, however, GME stock needs to definitively get back over $159, then its 10-day moving average. If it can do that, it opens up the rest of its moving averages. For bulls to really get some momentum going, the stock needs to clear these measures.
Currently, that means a move over the $195 level. If we can get that, then bulls may very well be back in control and $250 could be on deck.
GameStop Earnings Lacked
The company reported revenue of $1.3 billion, beating analysts’ estimates by $107 million and growing 29% year over year (YOY). However, earnings weren’t quite as good. GameStop lost $1.39 per share, badly missing expectations by 87 cents per share.
To be fair, though, the reason behind the miss isn’t that bad — at least in my eyes. Management front-loaded its inventory in order to avoid supply chain problems ahead of the holidays.
While that does leave GameStop vulnerable to inventory risk, the flip side is a situation like Gap (NYSE:GPS). That retailer had supply chain issues and suffered a massive decline in revenue in its most recently reported quarter, forcing management to reduce its outlook.
Moving on, one other negative was the increase in hardware sales and reduction in software sales. Hardware as a percentage of revenue climbed to 51.7% in the most recent quarter from 41.2% a year ago. Meanwhile, software sales fell to 33.5% of sales from 44.2% a year ago.
It’s not the end of the world of course. But investors like to see the shift to software sales from hardware, as a percentage of total revenue. Not the other way around.
It was good to see the company end the quarter with cash and equivalents of $1.41 billion and no debt “other than a $46.2 million low-interest, unsecured term loan associated with the French government’s response to COVID-19.”
Bottom Line on GameStop Stock
All things considered, I honestly didn’t find the quarter to be all that bad. Obviously, there are some things we’d like to see — like a profit — and GameStop is not the best way to play the video game industry, in my opinion.
However, as far as quarterly reports go, this wasn’t exactly a disaster.
That said, the charts need a hand before being bullish. That’s got the technicals looking fuzzy at best, and at worst, flashing some serious warning signs. It doesn’t help that the fundamentals don’t back this one up.
Moreover, analysts expect a slightly down year in revenue next year and just 9% revenue growth in 2023. Neither this year nor next year is forecast to generate a profit. Despite this, GameStop stock commands a market capitalization of $12.1 billion.
When we blend the technicals and fundamentals, it’s hard for me to be overwhelmingly bullish. As a trade, that could change, but the stock needs to prove itself from here.
On the date of publication, Bret Kenwell did not have (either directly or indirectly) any positions in the securities mentioned in this article. The opinions expressed in this article are those of the writer, subject to the InvestorPlace.com Publishing Guidelines.
Bret Kenwell is the manager and author of Future Blue Chips and is on Twitter @BretKenwell.