Will the 200-day moving average be a floor or ceiling? … checking in on the yield curve … how high will rates have to go to curb inflation? … what’s Powell thinking?
Investors have enjoyed a respectable bounce over the last two trading sessions.
But whether “respectable” turns into “sustained” isn’t clear.
Below, we look at a chart of the S&P 500 with an added overlay called the RSI, or Relative Strength Index. This is a momentum indicator that measures the extent to which an asset (or index) is overbought or oversold.
When an RSI reading climbs above 70, it typically points toward overbought conditions. When it dips below 30, that usually corresponds with oversold conditions.
When markets become too overbought or too oversold, they tend to reverse dramatically in the opposite direction.
You might think of it like a rubber band zooming across a room after being stretched toward the limits of its elasticity.
Below, I’ve circled the S&P’s RSI, dipping below 30 and now shooting north.

I believe that investors, exhausted with weeks of selling, are ready to let this rubber band sail a bit.
But the real test as to whether it will last may come this week based on the S&P level of 4,436. That’s the S&P 500’s 200-day simple moving average (SMA).
***Will the 200-day SMA be a ceiling or a floor?
As its name suggests, the 200-day SMA is a line showing the average reading of the prior 200 days’ worth of market prices.
It’s an important long-term psychological line-in-the-sand for investors that helps them see the overall trend for a stock (or an entire market).
For example, if a price falls below the 200-day SMA, traders usually interpret this as a bearish long-term trend change. To avoid potential losses, some traders will sell, which can intensify the move south, leading to even bigger price declines.
The opposite is true as well. A push north through a 200-day SMA is often seen as a bullish indicator. This can attract more buyers, which leads to bigger price gains.
Importantly, many of today’s computerized trading algorithms are programmed to buy or sell based on where market prices are relative to this 200-day average.
Below, we look at a chart for the S&P 500 over the past three years.
As you’ll see, we just dipped below this long-term trend line for the first time since the Covid-bear in 2020. But the rally at the end of last week pushed us back above it by a hair.
The issue now is whether the emotional bounce that began last Friday will turn the 200-day SMA into a springboard…
Or…
If the bounce runs out of gas, and the 200-day turns into a ceiling.
If that happens, the market is likely in for a deeper pullback.
To find out, we’ll have to watch the S&P complete this latest push north, turn south again, then see how it handles the 4,436 level.
We could see this play out later this week. We’ll keep you updated.
***Meanwhile, the 10-2 Spread that we’ve suggested you monitor didn’t react well to Powell’s press conference last week
Another indicator we’ve put on your radar is the “10-2 Treasury Yield Spread.”
As the name suggests, it’s the difference between yields from the 10-year and 2-year Treasury rates.
Think of it as a way to monitor the shape of the yield curve. As we’ve detailed in past Digests, a flattening yield curve can be serious economic warning sign.
That’s because an inverted yield curve (where the curve moves from top-left to lower-right) has historically been viewed as a precursor to a recession. A negative 10-2 spread has predicted every recession from 1955 to 2018.
We last looked at this 10-2 Spread in our January 19th Digest. Its level was 0.79.
As we noted around that time, the “Bond King” Jeffrey Gundlach said “the yield curve, like consumer confidence, is not sending a ‘Don’t Worry, Be Happy’ signal.”
It’s even less happy now.
That’s due to Federal Reserve Chairman Jerome Powell’s hawkish comments last Wednesday.
Below, we look at the 10-2 Spread over the last six months. I’ve pointed out where Powell spoke, leading to a steep decline.
As I write Monday morning, the level has fallen to 0.59% – a big-time drop from 0.79% in two weeks. For more perspective, the long-term average reading is 0.93%.
So, we’re currently well-below average and moving in the wrong direction quickly. This is a caution signal from the bond market saying “all is not well.”
All that said, there’s one thing that can fix it…
Growth.
***Whether we’re focused on the 200-day SMA or the 10-2 Spread, what will make or break both in the long-run is sustained economic growth
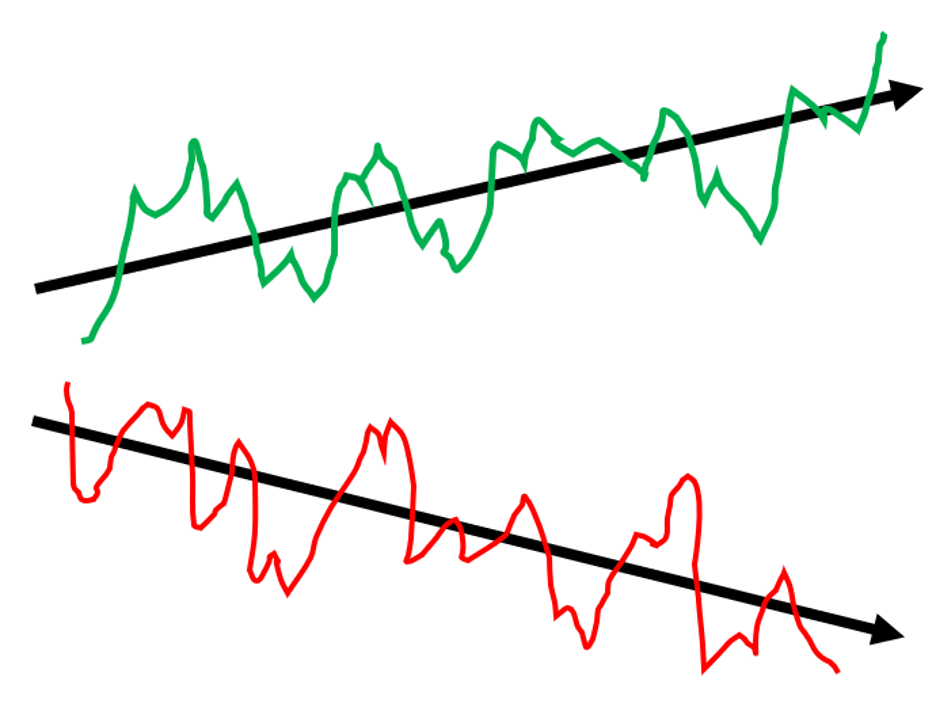
The value of the stock market can decouple from economic growth for a while. But over the long-term, stock prices reflect the presence (or lack) of economic growth, because growth translates into bottom-line profits.
Sure, prices can bounce all around the overall trajectory of a growth curve (or contraction curve). Such bounces are usually based on temporary bouts of greed and fear.
But the overall trend line of market prices takes its cue from economic growth. A simplistic illustration of this is below.
Economic growth (or contraction) are the black arrows. Stock market fluctuations are bouncing around in red and green. Please excuse my kindergarten artistry.
What will matter most in the coming months is growth. Unfortunately, that growth is put in a precarious position by the Fed’s new emphasis on curbing inflation.
I write “new” because, as we all know, the Fed dismissed inflationary pressures as “transitory” and not really a big deal for well over a year.
No more.
At last week’s press conference, Powell made it clear that taming inflation is the principle focus of the Fed today.
The problem is that robust economic growth and sustained (and rapid) rate hikes don’t play well together.
So, Powell can either err on the side of fighting inflation by raising rates…but higher rates will be a wet blanket on economic growth…
Or…
He can slow-play rate hikes in order to support economic growth…but that will allow inflation to continue eating away at consumer pocketbooks.
The hope is that there’s a sliver of “happy medium” in there.
But let’s look at that.
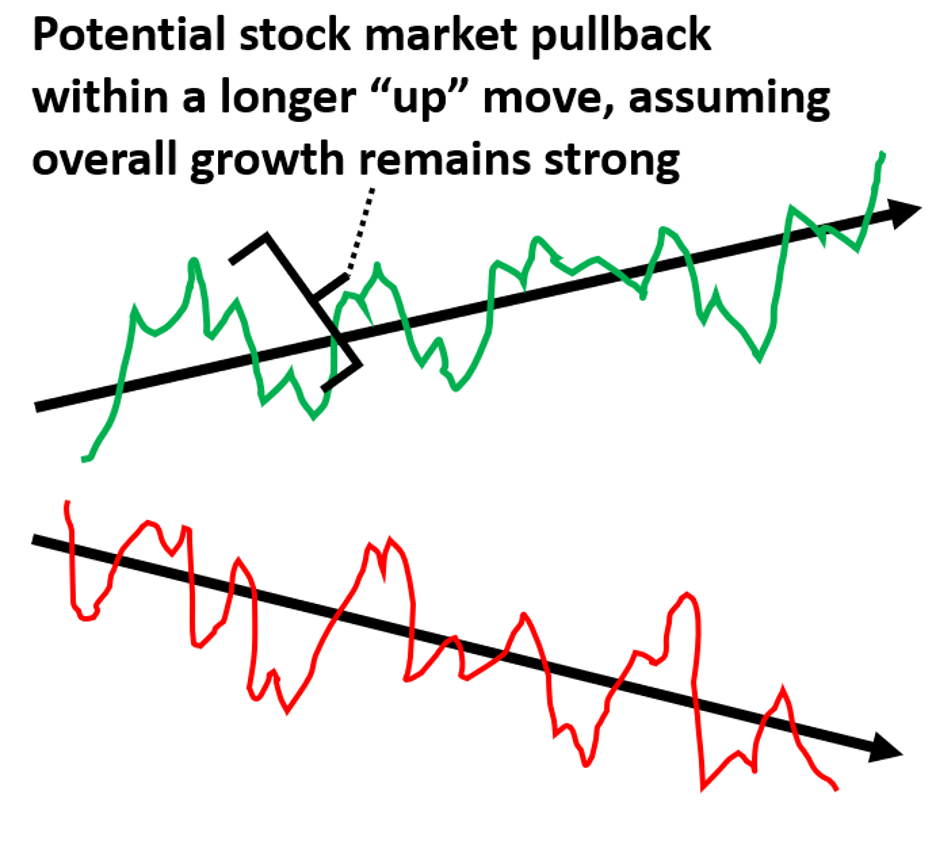
***Can the U.S. economy handle it if Powell raises rates a half point, or even three-quarters of a point?
Absolutely, yes.
The stock market won’t like it, but longer-term, it would be fine.
If we use our chart above to illustrate, it would be like a downward jolt of volatility from the market, though the longer-term growth story is still “up.”
Here’s how that might look…
But the question is “will a half-point or even a full-point raise actually curb inflation?”
***Well, what was required back in the 70s?
From The Balance:
Inflation began to skyrocket beginning in March 1973 when President Richard Nixon disengaged the dollar from the gold standard.
Inflation increased from 4.7% to 12.3% in December 1974. The Fed increased the fed funds rate from 7% in March to 11% by August.
Inflation continued to remain in the double digits through April 1975.
The Fed increased the benchmark rate to 16% in March 1975, worsening the 1973 to 1975 recession.
It then reversed course, dramatically lowering the rate to 5.25% by April 1975.
We won’t even touch on how high rates had to go to curb inflation in the early 80s.
Now, remember, the Fed Funds rate currently sits at 0%. Meanwhile, inflation as measured by the Consumer Price Index is 7%, the highest since 1982 as you can see below.
As we just saw from The Balance, in 1974, the Fed Funds rate went from 7% to 11%. And that was to curb a jump in inflation from 4.7% to 12.3%.
Again, today, we’re at a Fed Funds rate of zero with inflation already at 7%.
Is a half-point raise going to stop 7% inflation? Or might it be a bit like spraying a forest fire with a garden hose?
History suggests we might need a bit more firepower.
Perhaps that’s why last Friday, Bank of America economists suggested we’re going to see seven rate hikes this year.
I’m sorry, but seven hikes are not priced into this market.
The broader problem is that “more firepower,” like seven hikes, increases the risk of going from the “sloping up” growth curve to the “sloping down” contraction curve.
In other words, a recession.
This is Powell’s tightrope to walk.
From his press conference:
There’s quite a bit of room to raise interest rates without threatening the labor market.
This is a very, very strong labor market, and my strong sense is that we can move rates up without having to severely undermine it.
But again, how high will those rates have to go to squash this inflation?
In all my reading about this issue, I’m not finding any substantive analysis of how high (or how quickly) rates have to go to tame inflation that includes a data-driven explanation.
Perhaps there’s a reason – the Fed is flying blind. They don’t know. Look how varied the individual Fed members are when it comes to their projections about how many hikes we’ll need this year.
Lots of stabbing in the dark.
***Where’s Powell’s head at?
Two weeks ago in the Digest, I wrote the following:
If I was a betting man, I would wager that if Powell is going to misstep, look for him to favor inflation over heightened market turbulence.
I’m wondering now if my analysis was short-sighted.
Powell seemed little concerned with market losses at his press conference last week. The “Fed Put,” so to speak, no longer appears to be influencing him.
But it’s more than just that…
I’m wondering now if Powell is less concerned about hurting the market, or even slowing economic growth a tad, and more concerned about his personal legacy if he allows a repeat of 1970s-style inflation.
He has to be sensitive to the fact that popular opinion says he already got it wrong with his “transitory” narrative.
You have guys like former Treasury Secretary Larry Summers saying, very publicly, that Powell totally blew it. Summers even accused the central bank of creating a “dangerous complacency” in the financial markets.
To what extent will Powell’s sensitivity to this impact his desire to make sure inflation doesn’t grow worse?
That’s what the coming months will show us. But based on how he sounded last week, I believe Powell is increasingly anxious about inflation spiraling out of control – and what that could mean for his legacy.
***So, what do you do with all of this?
One – keep your eye on the 200-day Simple Moving Average. It will provide clues about short-term market direction.
Two – watch the 10-2 yield spread. It will give us an idea of how bond traders (who are usually right) are sizing up the growth/contraction prospects of the economy.
Three – monitor growth-related data such as GDP and earnings. That’s the major driver going forward.
Last – obviously, keep an eye on the inflation numbers.
Obviously, we’ll keep you up to speed on all these things here in the Digest.
But the bottom-line is that if Powell is, in fact, more concerned with not going into the history books as the captain when the ship sank into “The 70s 2.0,” then three or four rate hikes might be just the beginning.
Have a good evening,
Jeff Remsburg