A huge battle playing out between the bulls and bears … so much rests on Q2 earnings … get ready for a month of important data releases
As I write Monday around lunch, the markets are under pressure again. Meanwhile, the chorus of voices predicting a recession grows louder each day.
How is all of this going to end? And when, exactly?
Well, we need to clarify…
What is “this”?
Most unaware Americans (and many newer investors, for that matter) tend to view the stock market and the economy as similar creatures that rise and fall in parallel fashion.
It makes sense. The stock market is anchored by corporate earnings. Corporate earnings generally reflect the health of the economy.
Therefore, by the transitive property, the stock market should mirror the economy, right?
Well, broadly-speaking, yes, but there’s a wrinkle…
Timing.
When we check in on the condition of our economy, we use all sorts of data – job openings, unemployment rates, inflation, corporate earnings, real wages, and so on.
What do all these metrics have in common?
They’re all backward-looking.
For example, you don’t know the condition of unemployment until it’s happened, enabling you to measure it. But by then, it’s old news.
Meanwhile, what is Wall Street obsessed with?
The future.
In the pantheon of “business/investing clichés,” high on the list would be the phrase immortalized by the hockey legend, Wayne Gretzky:
I skate to where the puck is going, not where it has been.
The quote has been reused, recycled, and mangled by countless investment professionals in PowerPoint presentations for years, but it accurately reflects Wall Street’s laser-like focus on what’s going to happen.
Given this, even though Wall Street and the economy do loosely mirror one another, they rise and fall on different timetables, with Wall Street leading the way.
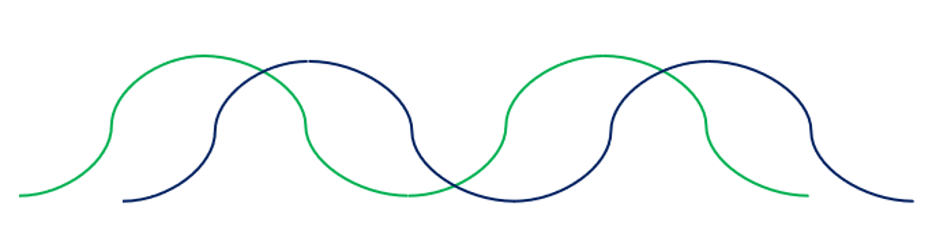
Here’s a crude illustration with stocks in green, frontrunning the economy in black.
Now, because of this difference in timing, many people become confused when stocks and the economy seem to contradict one another.
As a recent illustration, think back to spring/summer 2020, when the economy was imploding but stocks were soaring.
This pandemic-era screenshot below from Jim Cramer’s investment show Mad Money captures it perfectly.

While news pundits were wringing their hands, bewildered about how the stock market was surging while the economy was collapsing, there was a simple explanation…
The market had already collapsed and was now looking ahead to when the world would reopen.
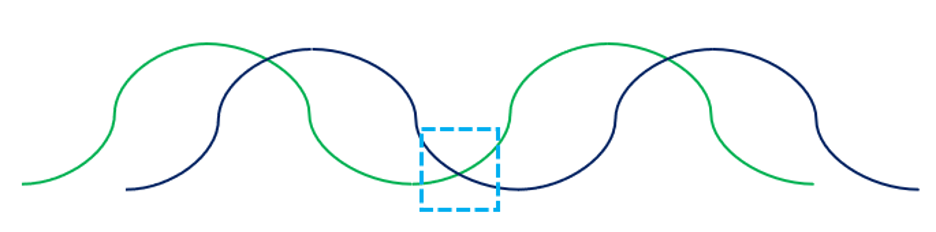
Below we return to our crude illustration, which approximates where this phenomenon occurred in 2020. You can see stocks (in green) on the upswing while the economy (in black) heads lower.
Given this timing-mismatch between stocks and the economy, if we want to estimate when our portfolio pain will be over, we should better understand what history suggests about the interplay between stocks and the economy, and the lag time between the two.
***The case for our current bear market being more than halfway over
Q1 GDP shocked many people by coming in negative.
And as I write, the Atlanta Fed’s GDPNow tool estimates that Q2 GDP will come in at -1.2%.
Given that the official definition of a recession is two consecutive quarters of negative GDP growth, we’re on track for an official recession declaration on July 28. That is when the Fed will release its official “advance estimate” of Q2 GDP.
Yes, GDP could surprise to the north and we barely escape a recession; we’ve seen GDP estimates revised higher in recent days, even though they’re still negative. But let’s assume we get one.
If so, that will mean that we’ll have been in a recession that started in January, so about seven months long as of the end of this month, when the official data come out.
Okay, let’s start there.
How far into a recession do stocks typically bottom out?
In a report published in late June, Goldman Sachs suggested that the low point in the stock market usually comes three to six months before the economy’s low-water mark.
Okay. So, where will the economy’s low-water mark be?
We don’t know for sure. No one does.
But using data from the National Bureau of Economic Research, I looked at the average peak-to-trough length of time of U.S expansion/contraction cycles since 1945.
The number came in at 10 months. I’ve read other reports suggesting the average duration is about 11 months. Let’s go with 11 months, to be cautious.
So, on average, it takes 11 months to reach the economic low. Now subtract Goldman’s estimate that stocks bottom three-to-six months before that low. So, dating from the beginning of an economic contraction, we’ve got a target range of five-to-eight months for our “stock low point.”
Well, if news later this month is that we’re in an official recession (that began in January), that will put us seven months into this cycle. Translation – we’d be in the range that Goldman suggests marks the stock market low.
So, by this math, we’re already well-beyond the halfway point of this current bear market – in fact, much closer to its end.
***But let’s be extra conservative: Forgetting “average,” what if today’s economic slide isn’t that far along yet, which pushes back the bear-market bottom?
There’s a good case for this.
As one example, the labor force remains quite strong – in fact, that’s part of the problem and why the Fed is hiking rates (a strong labor force fuels wage inflation, which fuels broader economic inflation).
Last Friday, we learned that the U.S. added 372,000 new jobs last month. That was well above the 250,000 Wall Street forecast. On top of that, the unemployment rate remained near a half-century low of 3.6%.
So, by these data, the economy isn’t too far into its correction. That suggests we may be further away from the “stock market low” zone than historical averages tell us.
But even if that’s true, what we can say about the economic contraction is that the snowball is beginning to roll down the hill.
Here’s MarketWatch illustrating this by highlighting last Friday’s data on the labor-force participation rate:
The so-called labor-force participation rate slipped again to 62.2% from a pandemic high of 62.4% in the early spring. The participation rate hangs 1.2 points below its pre-pandemic level, the equivalent of about 1.5 million missing workers.
And despite Friday’s jobs report, last Thursday brought a slightly different picture on unemployment.
From CBS News:
More Americans applied for unemployment benefits last week and while layoffs remain low, it was the fifth consecutive week that claims topped the 230,000 mark and the highest number in almost six months.
If you look at a chart of jobless claims, we bottomed out in March and have been ticking higher ever since.
Translation, at a minimum, the economic cycle has rounded its high point and is officially sliding. The only question is: “How far down are we?”
***What can we learn by looking at historical average bear market lengths?
So far, we’ve compared average contraction cycles with the point at which stocks turn north within such cycles. This has suggested we’re nearing our low point (if we get an official recession).
But forgetting the economy for a moment, what does a study of bear markets themselves tell us?
From CBS News:
On average, bear markets have taken 13 months to go from peak to trough and 27 months to get back to breakeven since World War II.
Given that the S&P peaked more than six months ago and the Nasdaq peaked roughly eight months ago, this suggests we’re roughly halfway through our bear market, according to this historical average.
And a second piece of data from CBS:
The S&P 500 index has fallen an average of 33% during bear markets in that time…
The S&P has fallen as low as roughly 24% in this bear market. As I write, we’re about 19% down. Yet again, crudely speaking, somewhere in the middle. Perhaps a bit beyond.
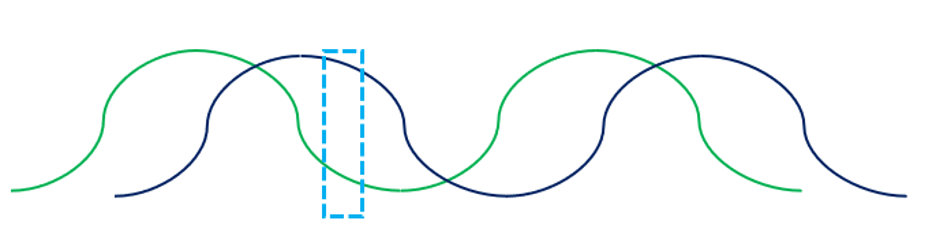
So, putting everything together, below is a rough guess at where we are if we go by historical averages.
You’ll see the economy (black line) headed south, but it’s still higher on the curve, not too far beyond our “peak” economy.
Meanwhile, stocks remain in decline, having been falling for a while. However, they’re now likely beyond their halfway point toward their bottom.
***So, when to buy…and what to buy?
It’s time to start adopting the following mindset…
Do not wait for things to feel good before you buy.
If you wait for stocks to feel safe, and for the economy to be showing abundant signs of strength, you’re going to miss a huge portion of market gains.
The best time to buy isn’t when things are great, it’s when things are going from “bad to “less bad.”
In a past Digest, we featured this quote from Sam Stovall, chief investment strategist at CFRA Research, with some blunt timing advice on this interplay between stocks and a recession:
Prices lead fundamentals—therefore the stock market falling into a decline is traditionally an indication that most investors believe we are headed for a recession.
When we do finally fall into a recession, that’s usually a good time to get back into the market.
This loosely echoes what we’ve seen in our own analysis so far.
An “official” recession typically occurs within a few months of the stock-market low.
So, the blunt rule of thumb is: When the data confirm that we’re in an official recession, that’s time to be adding to your portfolio.
***But let’s add one more twist to all this
As we frequently write here in the Digest, the “market” is not one big monolith that rises and falls in unison.
Instead, it’s comprised of thousands of different stocks that perform well, or poorly, in different market climates.
This differentiation also applies to sectors. They have their own leading and trailing cycles.
So, which sector tends to lead the average stock?
Technology. Specifically, growth stocks.
And when did they top out?
Hint – it wasn’t when the Nasdaq hit its peak last November. For many top growth stocks, it was well before that. See for yourself:
Below, I’ve picked a handful of top growth stocks – Desktop Metal, Opendoor, Fluence Energy, and AppHarvest.
If you’re having trouble reading the chart, their peaks clustered around February/March 2021.
So, what does this mean?
Well, while the broad bear market for the S&P might be approximately halfway done, the bear in tech-based growth stocks is likely closer to being completely done.
In fact, if we look at these same four stocks since early March, we see something interesting as of last Friday’s closing prices…
While one is down substantially, a second is up slightly. The remaining two are up 49% and 56%.
Together, this paints the picture of a sector trying its hardest to turn.
***Last Friday, I was texting with our hypergrowth expert Luke Lango and our CEO Brian Hunt
The thread was about how the tech-focused ETF, XLK has seen lots of insider buying in recent months.
Luke then texted something that I asked permission to share with our Digest readership.
I’ll let you read it yourself:
***So, what do you do with today’s Digest?
A handful of takeaways…
One, we’re already deep into the market pain, potentially beyond the halfway mark for the average stock.
Two, do not judge whether it’s time to buy back in by waiting for good news from the economy. The worst of the economic pain is still in front of us. If you wait until things get better in the economy, you’ll be too late in the market.
Three, when focused on stocks, look for a transition from “things are awful” to “hey, things are slightly less awful.” Remember, it’s all about “what’s coming,” not “what’s here now.”
Four, don’t view the market as one big entity. As we highlighted a moment ago, tech stocks could be on the verge of hitting their bear-market lows already, even though the average S&P stock low could come a few months out. It was a rolling bear market that brought us in, it will likely be a rolling bull market that brings us out.
On that note, if you want more from Luke on how he’s positioning himself for this “best time ever to buy tech stocks,” click here to learn about Innovation Investor newsletter.
***Before we sign off, a quick but important alert
Tomorrow, legendary investor Louis Navellier is sitting down with Whitney Tilson, another acclaimed market veteran known as “The Prophet,” to discuss an important turn in the market.
Here’s Louis in his own words:
Whitney and I both believe a historic turning point is coming to the market this summer, which could decide which stocks crash next… and which stocks have a real shot at rising 1,000%.
I don’t make that claim lightly.
Combined, he and I have recommended 37 different stocks that have risen 1,000+%… so at the very least, get our free pick.
Louis and Whitney will be emailing more information about this tomorrow. To learn more, totally free, just click here.
Have a good evening,
Jeff Remsburg