Warnings from Jamie Dimon, Jerome Powell, and Larry Fink … contextualizing our government’s debt/spending problem … gold’s role as a wealth preserver … how 3X gains could happen
From JPMorgan CEO Jamie Dimon back in January:
[The U.S. debt growth curve is] a hockey stick. That [steep part of the] hockey stick doesn’t start yet. We kind of got time.
But when it starts, markets around the world – by the way, because foreigners own $7 trillion of U.S. government debt – there will be a rebellion, and that is the worst possible way to do it.
It is a cliff. We see the cliff. It’s about 10 years out. We’re going 60 miles an hour.
From Federal Reserve Chairman Jerome Powell speaking on 60 Minutes last month:
The U.S. federal government is on an unsustainable fiscal path. And that just means that the debt is growing faster than the economy…
It’s probably time, or past time, to get back to an adult conversation among elected officials about getting the federal government back on a sustainable fiscal path.
Finally, here’s Larry Fink, CEO of BlackRock, from earlier this week:
[The U.S. public debt situation] is more urgent than I can ever remember…
More leaders should pay attention to America’s snowballing debt… A high-debt America would also be one where it’s much harder to fight inflation since monetary policymakers could not raise rates without dramatically adding to an already unsustainable debt-servicing bill.
No, this isn’t a doom and gloom Digest about how our government’s fiscal ineptitude is going to send us all into the poor house.
But it is a sober-eyed wake-up call that your wealth is increasingly in danger. Fortunately, you’re not without options for protecting and even growing it.
Let’s begin with the skeptic’s perspective…
People have been predicting a federal debt crisis for decades and yet here we are, seemingly doing just fine. Why is now any different?
That’s a valid question.
And frankly, it’s possible we have plenty of years ahead of us without a massive financial reckoning. But let’s look briefly at a handful of things that are different today versus, say, 30 years ago.
First, there’s the size of the national debt. Today, it sits at $34.6 trillion, which is more than 5X its size 30 years ago in 1994 when it clocked in $6.64 trillion.
But these are absolute numbers. Let’s contextualize them.
The easiest way to get a bearing on the scope of this debt is by comparing it to our national GDP.
In 1994, our nation’s debt-to-GDP ratio came in at about 64%. Today, it’s nearly double that at 121%.
In other words, for every $1 of productivity our nation produces, it’s also racking up $1.21 in debt.
Here’s the growth curve of this ratio dating to the mid-1970s for your viewing pleasure:

Even during World War II, when we were spending through the teeth with debt to fund the war, the figure clocked in at just 106%.
And remember that hockey stick curve that Dimon referenced? Well, here it is.
This is the projection of our nation’s debt through 2054 from BipartisanPolicy.org:
Next, there’s the size of the debt service payments themselves.
These interest payments are becoming one of the largest line items of our national budget.
For reference, in 1993, the interest paid on our national debt was under $300 billion. Today, it’s more than $800 billion. But again, let’s contextualize this.
As recently as the mid-2010s, the cost to service our nation’s debt was 1.2% of our GDP.
Last year, it was double that at 2.4% of GDP. This year, it’s projected to explode to 3.1%.
For even more context, the Congressional Budget Office projects that federal spending on interest payments will top $870 billion this year. That’s more than our nation will spend on its defense budget ($822 billion).
To be clear, none of this means that our nation is about to have a “guillotine chop” moment where our currency hyperinflates and we’re forced to pay for bread with silver doubloons. But it does suggest that the erosion of your spending power (that you’ve certainly felt over the last few years) is going to worsen substantially over the next decade.
So, what’s one of the best ways to protect yourself from this slow-motion trainwreck?
Gold.
If you’re suddenly feeling deflated after that reveal, I get it
So does our macro expert Eric Fry.
Here’s Eric contextualizing gold’s multidecade run of epic relative underperformance:
During the last 40 years, the Philadelphia Stock Exchange Index of gold and silver stocks (XAU Index) has produced a total return of roughly zero, while the S&P 500 Index has produced a total return of nearly 2,000%…
Dismal results like these reinforce the idea that gold is a dead-end investment that has no place in the modern world.
However, there are some bullish factors currently rallying behind price of gold. So, is the precious metal a good investment right now?
The short answer: yes.
Now, let’s clarify one thing…
Neither I, nor Eric, are making the claim that gold is about to go on a monster run that demands the immediate liquidation of your stock portfolio so that you can rotate into bullion.
But history shows that gold is a powerful portfolio diversifier and wealth buoy, even during times when world-class stocks are in freefall. So, ignoring gold’s role in a portfolio can be short-sighted.
On that note, here’s Eric with an illustration:
Let’s take a look at the specific decade-long span from November 2000 to November 2010, when gold stocks soared more than 450%.
During that identical 10-year period, the S&P 500 and Nasdaq Composite both delivered losses.
In other words, during that grim decade for stocks, gold stocks were one of the only assets to produce a gain.
The bottom line is that you don’t own gold to generate tons of wealth (though that can happen). You own gold to protect your existing wealth. Maybe from, say, a government that can’t stop spending?
Beyond our government’s debt problem, what’s the case for gold as it trades at all-time highs today?
Eric points toward four tailwinds. Here’s my annotation for brevity:
- Falling interest rates – The gold price almost always rises when interest rates trend lower… Chairman Powell reiterated [last] Wednesday that his team intends to initiate a new rate-cut cycle by lowering interest rates three times this year.
- Weakening dollar – Because interest rates are falling, the dollar exchange rate might also drift lower. A weak dollar usually manifests itself as a strong gold price.
- Rising geopolitical tensions – Almost nothing benefits from geopolitical tension or wars, other than weapons manufacturers… and gold. …The mere possibility of growing instability could support a strong gold price.
- Central Bank Buying – On a net basis, the world’s central banks have become large, consistent gold buyers… Central bank buying, by itself, will not trigger a major gold rally. But that buying could help power a rising price trend.
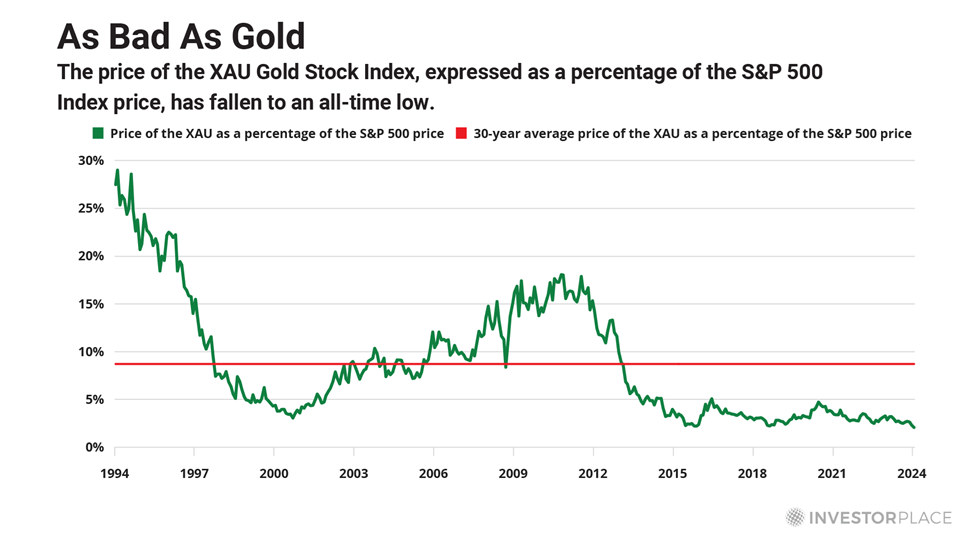
Best of all, Eric points toward the natural tailwind of gold’s low valuation relative to the S&P 500.
Even though, as just noted, gold trades at its all-time high, the cost of a gold hedge has rarely been cheaper.
As Eric’s chart below illustrates, the price of the XAU Index relative to the S&P 500 hit a new all-time low three weeks ago.
And if you’re still wedded to the idea that gold is incapable of offering anything other than sleepy, single-digit gains, here’s Eric with perspective:
Obviously, these extreme pricing and valuation disparities do not guarantee that gold stocks will soon begin closing the gap between themselves and the S&P 500. But they do suggest that the gold market is offering an attractive entry point, at least for a trade.
For example, if the XAU Index merely traded up to its average valuation, relative to the S&P 500, it would triple!
This attractive trade set-up is why Eric just added two new gold plays to his Speculator portfolio this week. If you’re curious about joining him in that newsletter, click here for more.
One final bit of context as you contemplate the relationship between our government’s debt problem and gold
In our Digest from two weeks ago, we highlighted a post from Charles-Henry Monchau, Chief Investment Officer at Syz Group.
He stated that the average price of gold in 1920 was $20.68 per ounce. Today, it’s worth more than $2,200 per ounce. Let’s call that a 100x increase.
Meanwhile, in 1920, the average house price in the U.S. was between $5,000 and $6,000. In 2023, it was $492,000. That’s in increase of roughly 80x – 100x.
That is the purchasing power of gold remaining solid over 100 years of chaos.
What hasn’t remained solid, thanks in large part to our politicians, is “dollars then” versus “dollars now.”
Guess how many dollars you’d need today to equal $100 in 1920.
Ready?
$1,551.63.
Bottom line: Our government has put your wealth on a collision course with currency debasement. Fortunately, history shows that gold is one of your best wealth defenders.
Invest accordingly.
Have a good evening,
Jeff Remsburg