The lowest CPI reading since 2021 … why didn’t Wall Street like it? … the historical data behind rate cuts … Luke Lango’s Great Tech Reversal event tonight
The headline Consumer Price Index (CPI) figure came in cool this morning, giving us a win in the fight against inflation.
Month-over-month CPI climbed 0.2%, in line with the Dow Jones consensus. This put the year-over-year rate at 2.5%, noticeably lower than last month’s 2.9% increase.
Core inflation threw us a little curveball, climbing 0.3% on the month. That was higher than the 0.2% forecast. However, the 3.2% year-over-year reading was in line with forecasts.
The stickiest part of this morning’s reading came from housing-related costs. The shelter component of the CPI climbed 0.5% on the month and 5.2% year-over-year.
Stocks sold off heavily this morning, though they’re rallying as I write around lunch. The Nasdaq has even turned positive.
It appears Wall Street spent the morning zeroing in on the uptick in monthly core inflation. The hotter-than-expected reading throws cold water on the market’s hope for a jumbo 50-basis-point interest rate cut next week.
Frankly, this market tantrum is silly and reveals a lack of awareness of market history
Barring a surprise that would shock every investor on Wall Street and roil the markets, we’re getting a rate cut next week. What’s been unclear is “what size?” and “what hints will the Fed provide about the pace of rate cuts looking forward?”
As is evidenced by today’s selloff, Wall Street clearly wanted a 50-basis-point cut. At first blush, this is understandable. After all, if rate cuts are good for stocks (which they are), then logic would suggest “more is better.”
But a study of market history throws cold water on this.
Lucas Downey, one of the lead analysts at our corporate partner TradeSmith, as well as the co-founder of MAPSignals, recently ran the numbers and the takeaway is overwhelming…
Investors should be rooting for only 25 basis points of cuts.
To illustrate, below we look at the S&P’s 12-month (and 24-month) performance differential between “slow rate cuts” and “fast rate cuts” following the start of a new rate-cutting cycle. We can think of this as a proxy for a single quarter-point cut next week versus a jumbo 50-basis point cut (though clearly, the pace of additional cuts this fall is critical).
In short, 25 basis points and “slow cuts” wins by a landslide.

This makes sense when we think of rate cuts from a “correlation” rather than a “causation” perspective.
Under what conditions would the Fed cut rates by 50 basis points?
Well, when the economy is collapsing, and outsized cuts are required as a sort of defibrillation shock to jolt us back from the brink. From this angle, a 50-basis-point cut correlates with more dire economic/market conditions.
By contrast, a 25 basis-point cut correlates with our “soft landing” narrative. The Fed is gradually easing off the brake, not frantically stomping on the gas.
So, we’ve been rooting for just a quarter-point cut. Our concern in recent weeks has been that a jumbo cut would spook Wall Street, resulting in speculation that the Fed is more concerned about our economy than it’s letting on. This morning’s data confirms that such a jumbo cut would have an eyebrow-raising effect.
So, ignore Wall Street’s pouting. One quarter-point cut is the right move.
How you can profit even if we’re wrong about the size of rate cuts…or wrong about everything else, for that matter
Let’s switch gears for a moment…
Most investors approach the markets with an implicit assumption that’s so ingrained, they don’t even see, or challenge, it anymore.
The assumption boils down to a simple equation…
“If… then…”
This can be different for each investor and their preferred market approach, but the overall formula never changes…
- “If I invest in low price-to-earnings (PE) ratio stocks that are growing their earnings, then I will make a lot of money.”
- “If I invest in leading AI stocks, then my portfolio will explode as this megatrend changes our world.”
- “If I limit my investments to companies generating huge free cash flow with massive returns on invested capital, then I will outperform the market.”
Whatever the specifics, the overall blueprint is always the same. “If” you follow your preferred investment style, “then” you’ll eventually enjoy the financial payoff.
But how many times have you followed your preferred market strategy perfectly, yet your chosen stock tanked?
Perhaps that low PE ratio stock kept drifting lower… the hot AI stock reported underwhelming earnings and heavy after-hours selling had you sitting on a 30% haircut at the opening bell… or the company with lots of free cash flow lost a key client and that cash flow evaporated overnight, resulting in a price crash…
Unfortunately, our if/then assumptions are not foolproof. But this points us toward the one ironclad truth of investing that is foolproof…
The only thing that matters to your wealth is whether a stock price climbs during the period in which you own the stock
That’s it.
Your analysis can be 100% right or 100% wrong, but if the stock price isn’t higher when you sell than when you bought, you lost money.
If we follow the daisy chain one step farther, this means that the ultimate market approach doesn’t center on a low PE ratio, or hot trend, or operational excellence – or even accurately predicting what the Fed will do…
It centers on price itself. This is basis for the old market phrase, “price is truth.”
So, here’s a revolutionary idea…
How about focusing on price?
When bullish price momentum is the cornerstone of your market approach, a lot of gray area investment issues become rather simple
If your stock is rising in an established, well-defined trend, you stay with it and make money. On the other hand, if your stock is falling or trading sideways in a clear, established pattern, you avoid it – no matter what any other indicators may be telling you.
Price is truth.
The reality is that price alone will make or break your retirement nest egg… or your savings for your child’s tuition… or the down payment on that lake house…
So, why not let go of your personal if/then assumption, and instead, focus purely on price action?
This is what our hypergrowth expert Luke Lango does in is trading service Breakout Trader
Luke uses a market framework called “Stage Analysis.” The underlying idea is simple…
At any given point in time, an asset is either going up, down, or sideways.
To that end, it’s always in one of four unique stages: 1) going sideways at a bottom, 2) going up, 3) going sideways at a top, or 4) going down.
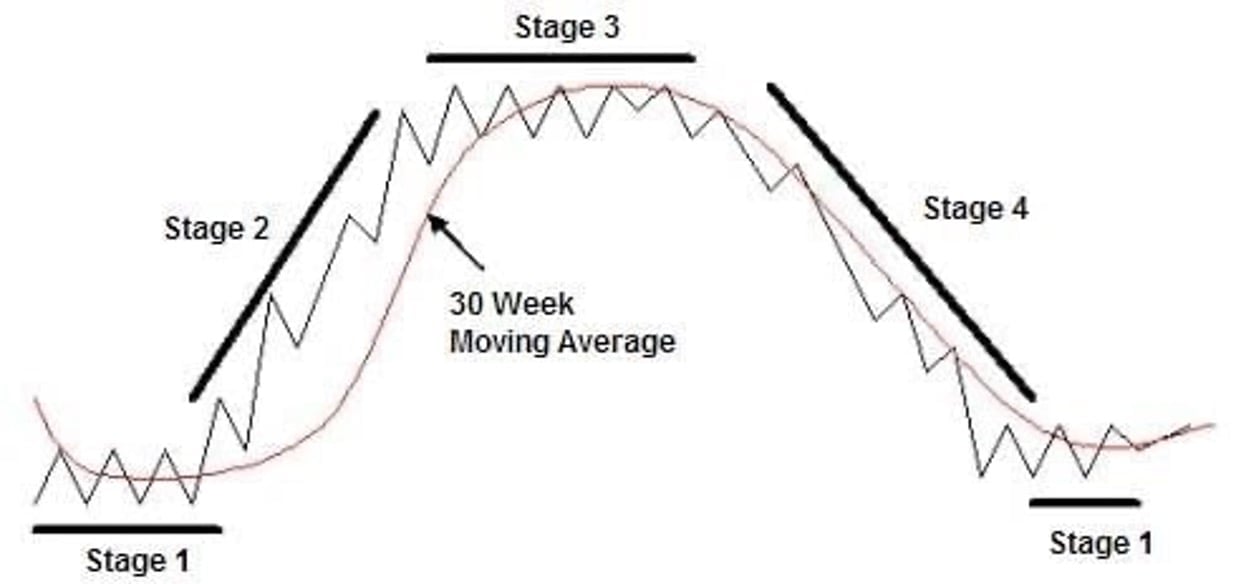
Stage analysis is the science behind figuring out which of these four stages a stock is in at any given point in time, and then only investing in a stock when it’s surging in Stage 2.
Clearly, this puts all the emphasis on price, which is the one variable that directly impacts your wealth.
Here’s Luke’s take:
…The only thing that will make a difference to your portfolio is whether the stocks you own rise in value while you own them.
Let’s say you found a truly atrocious company – we’re talking the opposite of a blue chip. It’s hemorrhaging cash, has awful management, and is in a dying industry.
But what if its stock price had just broken out and, hypothetically, was on its way to doubling from $5 to $10? Would any of those negative characteristics matter to you?
If what you care about is your personal wealth, they shouldn’t. Why would they?
All that would matter is that the stock is doubling while you’re invested…
When it comes to wealth-building, the only thing that truly matters is whether the share price moves in the direction you want during the period you own the stock.
This focus on price means we don’t have to predict how big the rate-cuts will be next week…and it frees us from our personal “if/then” assumptions
We simply assess a stock’s (or market’s) “truth” – evidenced through price action alone – and respond accordingly.
Now, there are plenty of details we’ve had to gloss over today due to our spatial limitations here in the Digest…
How do you know really know whether you’re in Stage 2 or some other stage? … what timeframe is the best so use in making such an assessment? … what are the specific indicators that shine light on the various stages? … how do you protect yourself if you misdiagnose a stage? … and many others.
But tonight at 8 PM EST, Luke is holding an event called the “Great Tech Reversal of 2024.” While its focus is on a massive shift in the economy/investment markets that Luke believes is about to generate a tidal wave of opportunity, his preferred manner of playing it is through Stage Analysis. So, he’ll get into some of these additional questions/details that we haven’t touched on today.
It’s going to be a great evening full of market commentary and portfolio strategy, as well as more about stage analysis.
Click here to instantly reserve your seat and we’ll see you tonight at 8 PM EST.
Have a good evening,
Jeff Remsburg