

At what point will the bears give up?
The S&P 500 is up 24% over the past 245 days. That’s a big and long rally. We never saw a so-called “bear market rally” that big or long during the COVID-19 crash, 2008 financial crisis, or dot-com bust.
In fact, since World War II, we’ve never seen a bear market rally this big.
Since 1940, every time stocks rallied more than 24% over 200-plus days, stocks entered a new bull market that usually lasted several years.
But if you’re still not convinced, an infallible technical indicator just flashed last week. It has a 100% track record over 70 years of signaling new bull markets.
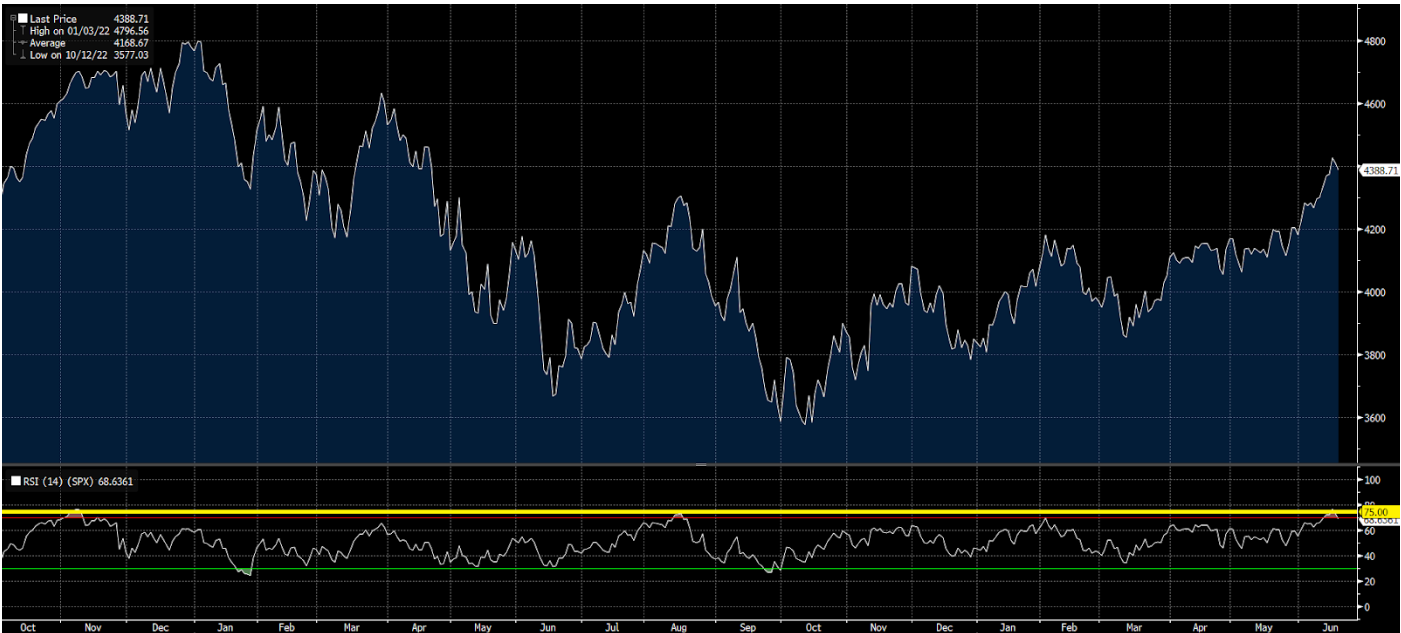
It is called the Relative Strength Index, or RSI.
RSI: Signaling the New Bull Market
The RSI measures the buying conditions in the stock market. It oscillates between 0 and 100. When the RSI pops above 70, stocks are considered overbought. When it drops below 30, stocks are considered oversold. Usually, the RSI bounces between 30 and 70.
Last week, the S&P 500’s RSI popped above 75 for the first time since late 2021. In other words, stocks became extremely overbought last week for the first time in over a year.
As it turns out, that is pretty rare price action. It’s also very bullish.
Between 1950 and 2020, the stock market registered just 15 prior occasions of becoming extremely overbought for the first time in over a year.
All 15 times, stocks were higher a year later, with an average return of over 17%.
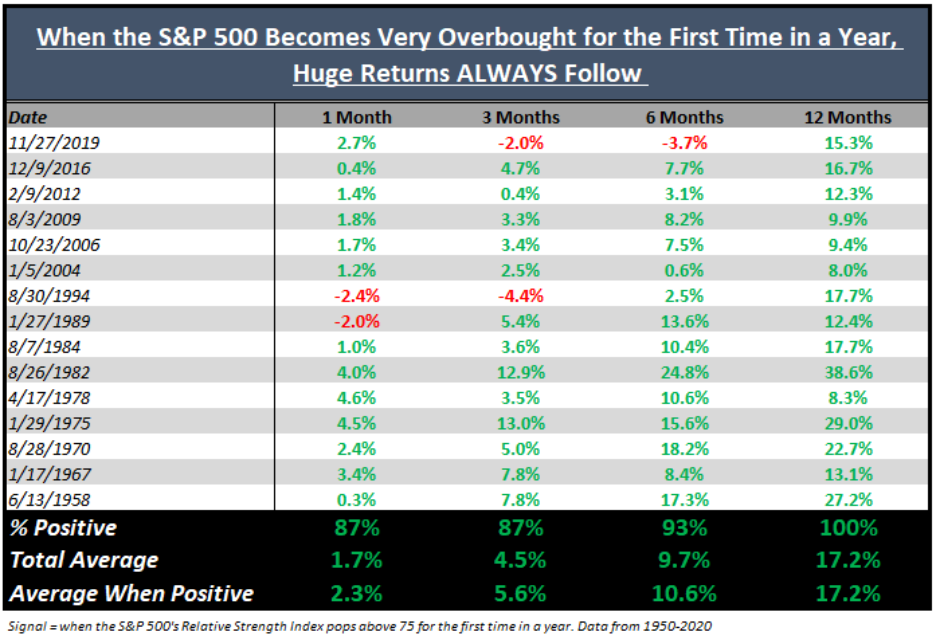
Moreover, this rare technical indicator almost always confirms the death of a bear market.
It flashed in August 2009, confirming the worst of the 2008 financial crisis was over.
It flashed in January 2004, confirming the worst of the dot-com bust was over.
And it flashed in August 1994, confirming the worst of the early 1990s recession was over.
This indicator consistently marks the end of bear markets – and the start of new bull markets.
And so, I ask again: When will the bears give up?
A new bull market is upon us. It’s time to forget opinions, follow the data, and make some money.
The Final Word
We think one of the best ways to play this new bull market rally is through AI stocks.
The emergence of artificial intelligence today bears strong similarities to the emergence of the internet in the 1990s.
Throughout the ‘90s, top internet stocks soared thousands of percent.
And we think that throughout the 2020s, the top AI stocks will soar thousands of percent, too.
We’ve just compiled the top five AI stocks to buy right now to potentially turn thousands into millions over the next few years.
Gain access to that portfolio.
On the date of publication, Luke Lango did not have (either directly or indirectly) any positions in the securities mentioned in this article.