
If you’ve been following Masters in Trading Live for any length of time, you’ll know that I do my best to stick to the facts.
I talk about risk.I talk about structure. I talk about process, positioning, and how professionals think.
What I don’t do is come on and say: “Here’s where I think the market will be on this date.”
I hate making flashy, time-stamped index hot takes.
That’s not how I’m wired – 99 times out of 100, I’d rather teach you how to think than hand you a headline to chase.
Of course, for every rule, there is always an exception. And that exception is happening right now.
After spending time digging through last week’s Federal Reserve data, yield-curve dynamics, and the plumbing of the Treasury market, I saw something I couldn’t ignore.
And for the first time in a long time, I feel like it’s time to weigh in.
So today I’m going to do something I almost never do:
I’m going to tell you exactly how I think Q1 2026 is going play out — and why.
So buckle up, because we’re about to explore a $2.5 trillion shift that’s flying under almost everyone’s radar.
Why the Market Feels Bearish… and Why That’s Only Half the Story
If you’re looking at your screen on a day-to-day basis, this market doesn’t feel great.
We’ve had choppy price action – weird selloffs and sharp rallies that fade just as quickly.
Headlines are still heavy with constant chatter about “higher for longer,” hard landings, soft landings, no landings… you name it.
So if you feel uneasy, that’s completely reasonable.
The real problem is that most traders stop there and don’t take the time to dig any further.
They feel that negativity and assume the whole story is bearish.
But the market isn’t driven by feelings. It’s driven by flows, plumbing, and incentives.
And all of those indicators tell a very different story about what’s likely to happen in the first quarter of 2026.
The Hidden Cushion: $2.5 Trillion That Was Never Fuel
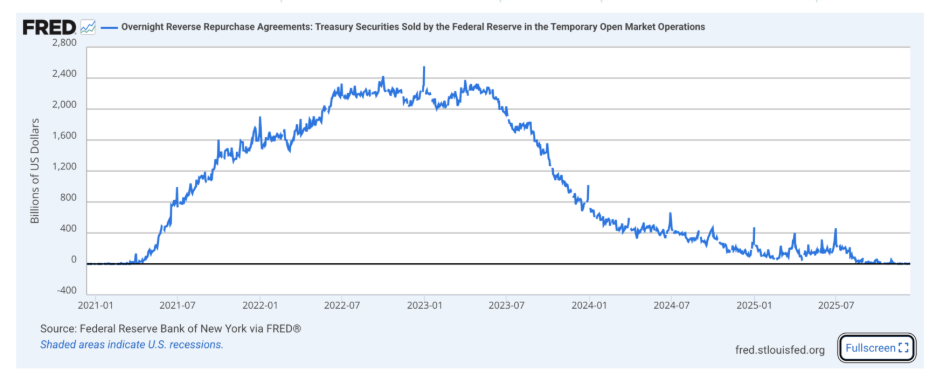
Let me introduce (or reintroduce) something a lot of people have totally forgotten about: the Fed’s Reverse Repo Facility (RRP).
Between 2021 and the peak of the tightening cycle, there was a massive pool of institutional cash parked at the Federal Reserve in the RRP. At its peak, it was about $2.5 trillion.
Now, here’s the important part: that money was not in stocks. It wasn’t in corporate bonds. It wasn’t chasing risk. It was parked at the Fed.
Think of it like this: the RRP was a parking lot for big institutional cash. When that money was sitting there, it was out of the game. It was a shock absorber for the system, not rocket fuel for the market.
Today, that shock absorber is basically gone. That $2.5 trillion cushion has been drained.
On the surface, that sounds scary. “No more cushion, volatility ahead!” That’s how most people read it, but that’s not the right question.
The right question is: if that cash isn’t sitting in the RRP anymore… where did it go, and who’s taking the other side of all the new issuance?
That’s where the real story starts.
The Fed Quietly Stepped In — and No One Wants to Call It What It Is
Here’s where things get interesting — and where I finally decided I couldn’t stay quiet and “agnostic.”
While everyone is still talking about “quantitative tightening,” the Fed has quietly told us what they’re going to do at the front end of the yield curve in 2026. They’ve signaled they’ll be buying somewhere in the ballpark of $240–300 billion in T-bills.
Now, line that up against expected net issuance at the front end, which is around $400–450 billion.
Do the math with me.
If net new issuance is around $400–450 billion, and the Fed is planning to buy $240–300 billion of that, they’re effectively stepping in to absorb close to 70% of all the new supply at the short end.
They don’t want to call that quantitative easing. Officially, we’re still in a tightening regime.
But if the central bank is gobbling up the majority of new T-bill issuance, pinning front-end rates and supporting liquidity, you can call it whatever you want.
Functionally, it’s a form of targeted QE at the front end. They are quietly putting liquidity back into the system.
And that has enormous implications heading into the first quarter.
What This Setup Means: A Steepener and a Risk-Asset Tailwind
Here’s what this means in plain English.
When the Fed pins the front end of the yield curve by buying that much paper, short-term rates get anchored. The long end—the 10-year, 20-year, 30-year—has more room to move.
That’s how you end up with a steepener: the curve, which was flat or inverted, starts to tilt back up.
Short rates stay relatively contained because the Fed is essentially “catching” that supply.
Meanwhile the longer rates have more freedom to drift higher.
So why does that matter?
Because when the curve steepens and the Fed is actively supporting the front end, bond volatility tends to get sucked out of the system.
And when bond volatility gets compressed, it changes the entire risk equation for large institutions.
If bonds stop whipping around, investors who were hiding in “safe” assets start getting more comfortable reaching out on the risk curve.
They move further out in duration, further out in credit, further out into equities.
And that’s where you can see some pretty powerful risk-on moves that don’t look connected to the headlines at all.
The Q1 Call I Almost Never Make
Now here is where I break my own rule.
Based on what I’m seeing in the plumbing — RRP drained, the Fed stepping in at the front end, the curve likely steepening, and bond volatility slowly getting choked out — I think the odds are stacked toward a strong move higher in risk assets into the end of Q1:
By April 1, 2026, I believe:
- SPY has a reasonable path toward 770
- QQQ outperforms meaningfully moving toward 735, driven by its sensitivity to liquidity and duration
- IWM participates topping out around 285, but lags the big indices
- The primary driver is liquidity and structure, not some sudden explosion in fundamentals
I think the real juice is in the big, liquid, duration-sensitive names that benefit when liquidity quietly improves.
Do I know the exact path day to day? Of course not.
This is trading, not physics.
There will be scares, dips, ugly candles, and scary headlines along the way. That’s the cost of admission.
But when I zoom out and look at the plumbing, this setup looks extremely bullish for risk assets into Q1.
I’ve spent two years on MIT Live avoiding time-stamped predictions.
This time, I’m willing to put a stake in the ground.
I feel strongly enough about the setup that I’m willing to put it down in writing and let you hold me accountable.
And that’s not something I say lightly.
The Kill Switch: When is Enough Enough?
No serious investor should ever make a call without also defining the conditions under which they’d walk away from it.
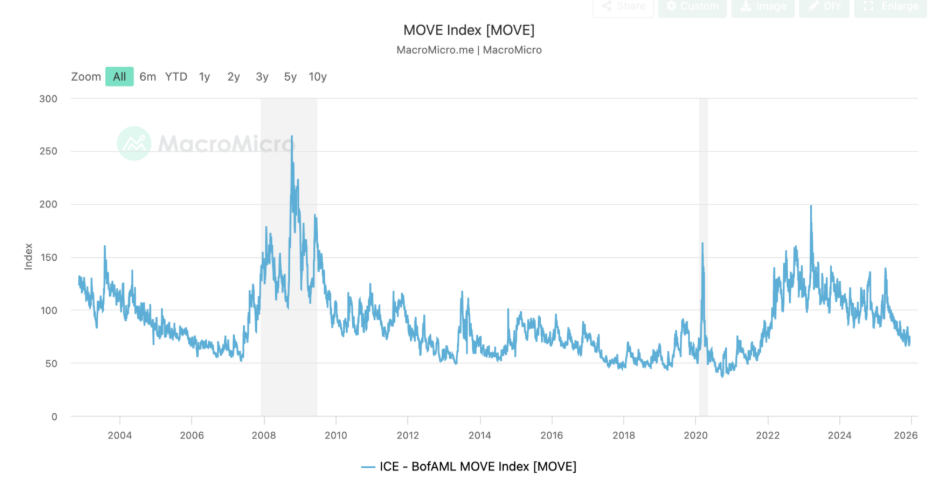
For me, the thesis lives or dies on bond volatility. That’s I’m watching the MOVE Index like a hawk.
If you’re not familiar with it, think of MOVE as the VIX of the bond market. It tracks implied volatility on Treasurys.
Right now, MOVE is offered. It’s soft. Volatility is being sold, not bought. That lines up perfectly with the idea of the Fed stepping in at the front end and taking the wildness out of the curve.
As long as that continues, the wind is at the back of risk assets.
But if MOVE spikes with speed — if we see a sudden, sharp repricing in bond volatility, not over months but over days — that’s when I start to get cautious.
It’s not just the level that matters, it’s the velocity.
Markets don’t usually crack on slow, grinding moves. They crack when something jumps.
So here’s my simple framework: Fed support at the front end plus a calm MOVE Index equals a constructive backdrop for equities into Q1.
A fast, ugly spike in MOVE is the warning light that tells me this whole structure is starting to wobble and this whole Q1 tailwind can evaporate quickly.
That’s my kill switch.
What Professionals Watch (That Most Retail Traders Ignore)
This is the kind of thing professionals watch that most retail traders completely ignore.
Retail pays attention to headlines, Fed press conferences, and whatever meme is trending that week.
Pros are watching things like MOVE, VIX, VVIX, term structure, and the relationships between them.
They’re not obsessed with today’s candle; they’re obsessed with the behavior of volatility and the plumbing underneath price.
What I’m trying to do here is bring you into that world.
If you’re looking at all of this and thinking, “OK, great… but how do I actually trade it?”, that’s exactly where the Masters in Trading Challenge comes in.
Over the course of the Challenge, we’re going to slow things down, walk through real examples, and give you a simple structure you can carry with you into Q1 and beyond.
It’s not about predicting every twist and turn; it’s about knowing how you’ll respond when the market does what it always does – surprise people.
If you want a bit more structure and a bit less guesswork heading into this next stretch, that’s the room you want to be in with me. Follow this link to find out all about it.
I don’t expect you to become a bond trader overnight. That’s my background, not yours.
But if you understand even a little bit about why this RRP drain plus Fed front-end buying plus muted bond volatility matters, you’re going to be miles ahead of the average trader who just says “it feels bearish” and stops there.
Why I’m Willing to Be Held Accountable
So where does that leave us?
It leaves us in a market that feels uncomfortable on the surface… but is actually setting up for a potentially powerful move higher underneath.
It leaves us with a Fed that says “tightening” but is quietly behaving a lot closer to easing at the front end. And it leaves us with a very simple mandate:
Watch the plumbing. Watch the volatility. And don’t let your emotions talk you out of what the structure is telling you.
We’ll revisit all of this around April 1, 2026.
I’ll pull up the charts, show you where SPY and QQQ ended up, walk through what the MOVE Index did, and we’ll go line by line over what played out.
If I nail it, great—we’ll learn from that.
If I’m early, late, or wrong, we’ll learn from that too.
I don’t normally do this. But the $2.5 trillion shift out of the RRP, the Fed’s quiet grab at the front end, and the suppression of bond volatility together create a setup I can’t ignore. And that makes me incredibly bullish into Q1 2026.
I’m not sharing this to be provocative.
I’m sharing it because I believe traders and investors deserve a view that’s grounded in data and structure — not just vibes and narratives.
Until then, stay creative, stay risk-aware, and don’t confuse noise with signal.
The creative trader wins,
Jonathan Rose
Senior Analyst, InvestorPlace