

Note from Louis: The stock market came roaring back in October, with the S&P 500, Dow and NASDAQ all soaring higher. The fact of the matter is we’re in the midst of a massive market rebound, so I firmly believe the bear market is coming to an end. And I’m not the only one…
My friend and InvestorPlace colleague Luke Lango is also incredibly bullish on the market, due in part to a major technical indicator with a 100% track record of signaling a market bottom and predicting stunning returns over the next 12 months.
But Luke isn’t just bullish on stocks right now… he’s also incredibly bullish on the crypto market. He expects the crypto market to enter a “boom cycle” in 2023, so he’s decided to hold a special Crypto Insider Summit with his friend and colleague Charlie Shrem on Thursday, Oct. 27, at 4 p.m. Eastern time. I only follow and recommend stocks, so if you’re interested in learning more about the crypto market and how to profit off of it, you can sign up for the event here.
And if you’d like to learn more about the major technical indicator that’s indicating major gains ahead, read Luke’s article below.
Over the last two weeks, my team and I have become the most bullish we’ve ever been since the COVID-19 pandemic emerged in March 2020.
Why? Because dozens of the fundamental, technical, and sentimental indicators that we closely track have hit extremes recently. And they’re extremes that they only tend to hit when bear markets bottom and bull markets are born.
And last Friday afternoon, we discovered the most compelling of these indicators.
It’s a technical indicator that flashed an “extreme fear” signal just last week. This indicator has flashed this exact same signal more than 100 times over the past 32 years. Every single time, the market was higher a year later, with an average return of nearly 30%.
Of course, after we discovered this technical indicator, we became more bullish than ever.
This bear market may not be completely over. But it’s almost certainly in its final innings. And the weight of evidence today strongly suggests that investors who invest now will make a lot of money over the next 12 months.
Here’s a deeper look.
The Weakest Market Ever?
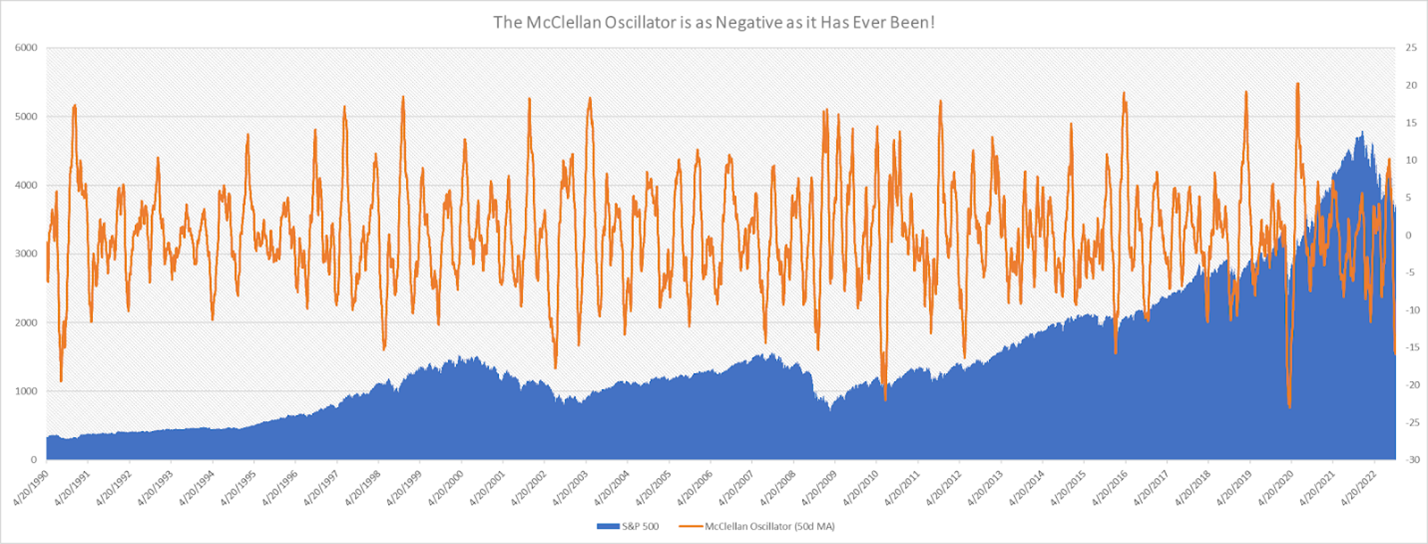
The technical indicator we are referring to is the McClellan Oscillator.
In short, it is a unique statistical measurement of the number of advancers in the market relative to the number of decliners. It’s a market breadth indicator, which can be applied to both stocks and cryptos.
Specifically, the indicator measures the difference between the 19- and 39-day exponential moving averages of net advancing assets. The higher the difference, the wider the market breadth. The lower the difference, the narrower the market breadth.
The McClellan Oscillator is broadly considered the best way to measure market breadth.
In any event, the 50-day moving average of the McClellan Oscillator dropped below -15 last week, and it has stayed below that reading ever since.
That’s an unusually weak McClellan Oscillator reading. It’s about as weak as the reading has ever been. It speaks to “peak fear” and “peak weakness” in the market.
For context, this oscillator has dropped below -15 only 109 times before on record (going back to 1990), meaning the oscillator has spent just 1.4% of trading days where it is today (below -15).
Now, here’s the bullish part: The markets tend to rally big after the McClellan Oscillator gets this negative.
And not just sometimes – but ALWAYS.
A Perfect Track Record
Guess when the last time was that the McClellan Oscillator was this negative? Yep – March 2020, at the depths of the COVID-19 pandemic.
How about before that? June 2016 – right after the Brexit vote.
And before that? June 2012, when everyone was worried that the economy would slip back into a deep recession.
The McClellan Oscillator was also this negative in June 2010 (amid a foreign debt crisis), November 2008 (at the depths of the great financial crisis), August 2002 (the bottom of the dot-com crash), June 1999, and August 1990.
What do all these months have in common? They were all very, very close to an absolute bottom after a stock market rout.
The other thing they have in common?
Markets soared in the months that followed.
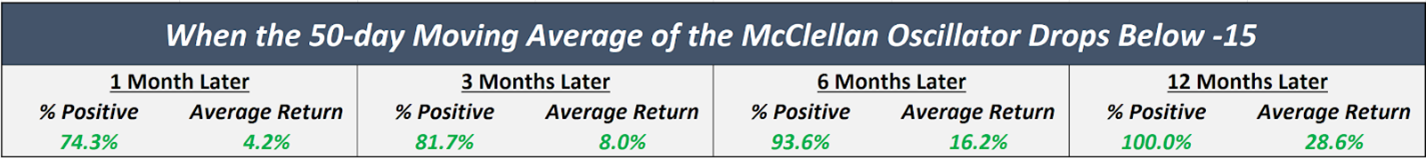
Here’s the exact data. Since 1990, on the 109 occurrences when the McClellan Oscillator dropped below -15:
- 74% of the time, markets were higher a month later, with an average return of 4%.
- 82% of the time, markets were higher three months later, with an average return of 8%.
- 94% of the time, markets were higher six months later, with an average return of 16%.
- 100% of the time, markets were higher 12 months later, with an average return of 29%!
In other words, we just discovered a technical indicator with a 100% track record (on over 100 data points) of calling a market bottom – and predicting massive returns over the next 12 months.
That’s a big deal.
And it’s not just stocks, but cryptos that benefit from a low McClellan Oscillator reading…
A Bitcoin Triangle Convergence
It increasingly appears the crypto market is working through a bottoming process right now. There’s a ton of evidence suggesting as much.
If so, that’s incredibly bullish, because the greatest returns are made when bear markets turn into bull markets.
The ostensible appearance is that cryptos are consolidating right now before their next big move, and the plunging McClellan Oscillator is one massive data point in our favor. And we believe now is the time to position ourselves for “Boom Cycle 2023”!
Cryptos are a hedge against money-printing and a major risk-on asset. Therefore, cryptos tend to work exceptionally well when monetary policy is loosening, and they tend to crash when monetary policy is tightening. Monetary policy has been tightening all year long, hence the crash in cryptos. But the macroeconomic tides are starting to turn – inflation is falling, the economy is cooling, markets are crashing, financial stress is building, etc. – in a way that’s supportive of a Fed policy pivot. Tightening will turn into loosening at some point in 2023, and likely at the first hint of this potential pivot, cryptos will soar and enter a new boom cycle.
We became more convinced of this thesis this past week.
Why? Because Wall Street Journal reporter Nick Timiraos (who is widely considered to be “the Fed’s mouthpiece”) wrote about growing concerns within the Fed calling for a rate hike slowdown.
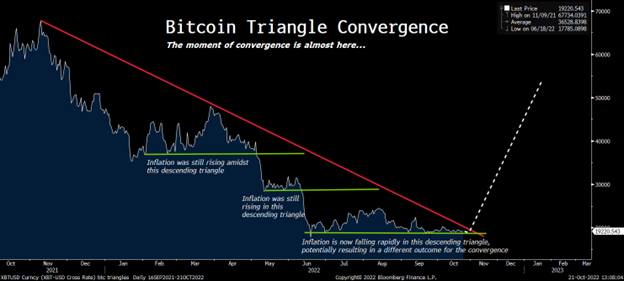
This policy pivot is underway, and just in time for the third convergence on our “Bitcoin Triangles” chart, which graphs the price action on Bitcoin (BTC-USD) as a series of descending triangles. Notably, every single major move in Bitcoin year-to-date has been sparked by a convergence of descending triangles.
The third convergence is due in early November, which is also when the Fed meets next.
Therefore, the time to start “phasing in” to cryptos has come. And the tokens we’re moexcited about are those that add real-world value — cryptos using the blockchain to solve real-world problems like the energy crisis.
These are the cryptos my good friend and colleague Charlie Shrem and I will discuss on Thursday, Oct. 27, at 4 p.m. Eastern during our special Crypto Insider Summit.
To prepare yourself for Boom Cycle 2023, simply reserve your spot now and receive our Crypto Watchlist completely free!
We’ll be releasing new, insider-only content up until that special broadcast airs, so don’t miss out…
Then make plans to attend the event Thursday, as Charlie will reveal his No. 1 crypto to buy for the dApp megaboom.
Learn more about and reserve your spot for our Crypto Insider Summit here.
Sincerely,

Luke Lango