

It was a big week for economic data.
The latest consumer and wholesale inflation reports – the Consumer Price Index (CPI) and Producer Price Index (PPI) – as well as the most recent retail sales report, were announced. Due primarily to higher energy prices, inflation at both the consumer and wholesale levels came in hotter than expected. Yet, interestingly, it didn’t deter consumers, as retail sales came in much better than anticipated.
In today’s Market 360, let’s review the CPI and PPI reports for August, as well as the U.S. retail sales report for August. Then, I’ll share what this could mean for the upcoming September Federal Open Market Committee (FOMC) meeting. But with inflation back on the rise, you need to “inflation proof” your portfolio, and I’ll explain how you can do that, too.
Consumer Price Index (CPI)
The Consumer Price Index (CPI) reading for August was released Wednesday morning, and it didn’t look very good on the surface.
The latest CPI showed headline inflation increased 0.6% in August and is up 3.7% year-over-year, which is up from the 0.2% rise and 3.2% year-over-year increase in July. Rising crude oil prices drove much of the gain in CPI in August, with energy prices soaring 5.6% in August and gasoline prices up 10.6%.
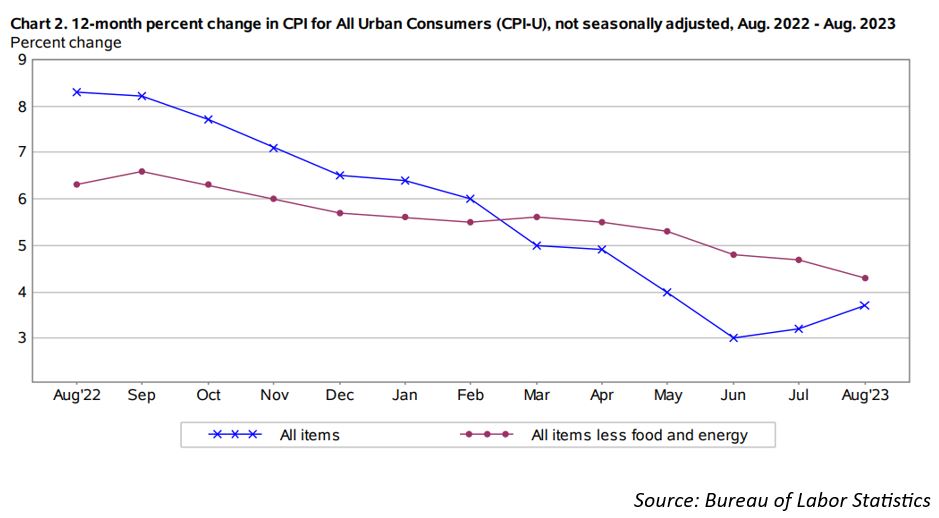
Clearly, the increase in headline inflation last month was all energy and food related – but when you back out food and energy, the numbers look much better. Core CPI, which excludes energy and food, rose 0.3% in August and is up 4.3% year-over-year. That compares to a 0.2% monthly increase and a 4.7% annual rise in July. Economists expected core CPI to rise 0.2% in August and 4.3% in the past 12 months.
I should also add that Owners’ Equivalent Rent (OER) only rose 0.3% in August, which was the smallest increase in a year. So, housing inflation has started to cool, and that was a welcome development.
Producer Price Index (PPI)
The Producer Price Index (PPI) report for August was released Thursday morning, and it showed that wholesale inflation is also running a little hot. Headline PPI rose 0.7% in August and is up 1.6% year-over-year, which compared to economists’ estimates for a 0.4% monthly increase. The PPI energy index soared 10.5% in August, as gasoline prices jumped 20%.
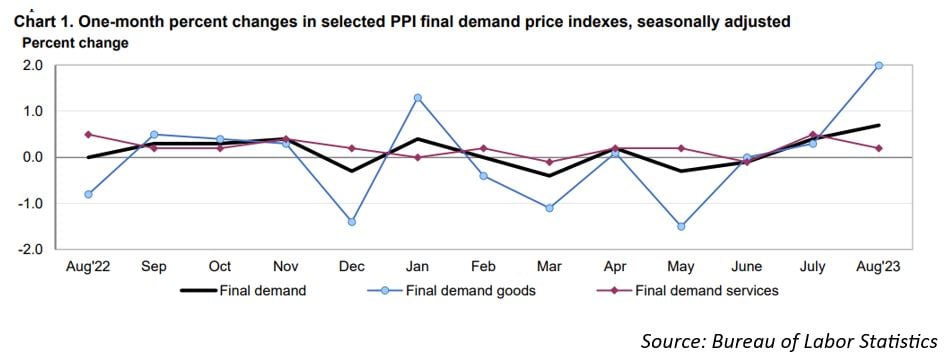
However, when we back out food, energy and trade services, PPI only rose 0.3%. And when you exclude food and energy, PPI increased just 0.1%. So, while the headline numbers are bad, the details are great.
Retail Sales Report
Also, on Thursday, the retail sales report was boosted by the recent increase in prices at the pump. The average price of gasoline was $3.84 per gallon In August, up from $3.60 per gallon in July. As a result, retail sales rose 0.6% last month, beating economists’ expectations for a 0.1% rise. Even if you exclude gasoline sales, retail sales increased 0.2% in August.
Interestingly, July’s strong retail sales report was revised down to a 0.5% gain, down from 0.7% previously reported. Nine of 13 retail categories reported an increase in August. Higher gas station sales accounted for a high proportion of retail sales, so this retail sales report will be dismissed as an anomaly by many economists.
Are More Rate Hikes in the Cards?
This week’s consumer and wholesale inflation reports follow the Personal Consumption Expenditure (PCE) index – which is also the Federal Reserve’s favorite inflation indicator. The PCE rose 0.2% in July and was up 3.3% in the past 12 months. Core PCE, which excludes food and energy, also increased 0.2% in July, and it was up 4.2% in the past year.
Given that inflation accelerated again in August, the Fed might raise interest rates one more time. However, some analysts key interest rates to raise 25 basis points in November, instead of September. This would mean that the Fed would hold rates steady at its FOMC meeting next week.
So, what does this mean for your portfolio?
Regardless of what the Fed plans to do, your best bet for profits is “inflation proofing” your portfolio by adding fundamentally superior stocks. The last 10 days of September should be especially good for
fundamentally superior stocks, as this is when the quarter-end window dressing season will commence. Institutional investors will chase after companies that can consistently grow their sales and earnings… like my Growth Investor stocks.
So, if you want to prosper in the current environment, and you’re not sure where to start, join me at Growth Investor today. You’ll have full access to my latest buys, Top Stocks lists, as well as my High-Growth Investment and Elite Dividend Payers Buy Lists.
I am confident that these are the stocks that will emerge as the market leaders and deliver strong profits to investors.
Click here to learn more about Growth Investor – and how to become a member – today.
(Already a Growth Investor subscriber? Go here to log into the members-only website.)
Sincerely,
Louis Navellier
P.S. If you want to play the AI markets, but aren’t sure exactly how to get started — or you are concerned about the potential risks — the “AI Master Key” is the perfect way to do it…
The “AI Master Key” is a way to potentially unlock the AI industry’s biggest, fastest gains… but with nowhere near the amount of risk of buying small, unproven stocks.
I’ve put together this urgent presentation to share with you one of the most important discoveries of my career… the “perfect AI investment.”