Expect More Chaos if the Fed Can’t Fix the Yield Curve
A strategy for protecting your wealth
By
Louis Navellier, Editor, Growth Investor
Apr 7, 2024, 12:00 pm EDT
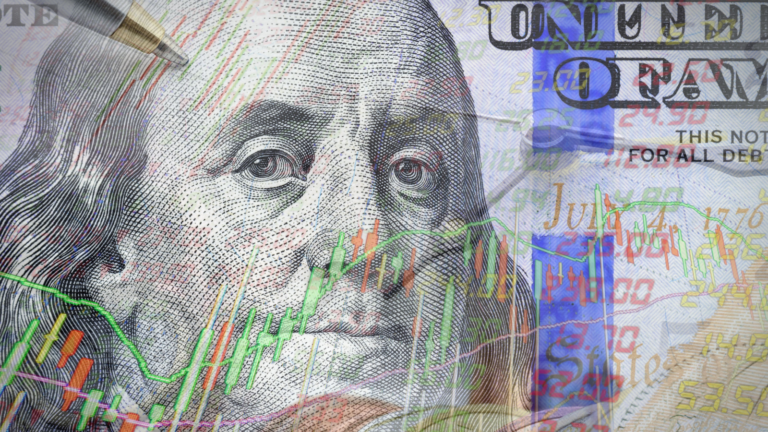
Source: William Potter / Shutterstock.com
2024 has been a record-setting year for the market.
So far this year, the S&P 500 has notched a whopping 22 record closing highs… the Dow has hit 17 record closing highs (and came within 0.5% of 40,000)… and the NASDAQ has set four record closing highs.
In addition, the S&P 500 posted its best first-quarter performance since 2019.
However, there’s one important record that hasn’t been talked about much: The 2-year and 10-year Treasury yield curve has now been inverted for more than 628 days (it inverted in early July 2022). This tops the 624-day stretch the yield curve was inverted in 1978.
An inverted yield curve is when short-term yields rise above long-term yields. In this case, the 2-year Treasury yield is at about 4.6%, while the 10-year Treasury yield stands at about 4.37% (as of this writing).
The last time the 10/2-year Treasury yield curve inverted was in 2019, during the global economic recession triggered by the Covid pandemic.
So, what was largely responsible for the inversion in 2022? The Federal Reserve.
Back in 2022, consumer inflation reached 40-year highs – climbing as high as 9.1% in June. To help rein in inflation, the Fed had to raise key interest rates. So, at the June 2022 Federal Open Market Committee (FOMC) meeting, the Fed upped the federal funds rate by 75 basis points to 1.5% to 1.75%, and then increased rates by another 75 basis points at the July FOMC meeting to 2.25% to 2.5%.
From March 2022 to July 2023, the Fed raised rates 11 times.
Although the 2-year and 10-year Treasury yields have come down significantly from their highs (both cracked 5% in 2023), the 10-year Treasury yield moved back up and broke 4.4% (its highest level since November) on Tuesday.
So, today, we’ll take a look at why inverted yield curves are “bad,” what caused the spike in the 10-year Treasury yield and what the Fed can do to not only bring the yield down but un-invert the yield curve.
Plus, I’ve scheduled a special Election Shock Summitfor next Wednesday, April 10, at 8 p.m. Eastern time, where a special guest and I will go over how to best position your portfolio for profits before May 1… because there’s no guarantee the Fed can un-invert the yield curve. I’ll tell you more about that event below (though you can reserve your seat now by clicking here).
But first, let’s take a deeper dive into Treasury yields.
Lethal for Banks – and Potentially Your Portfolio
Treasury yields are basically the interest you earn when you own U.S. Treasury bills, notes, bonds or inflation-protected securities. The U.S. Department of Treasury sells these securities as a way to pay for the U.S. debt.
The first thing to know about bond yields is that they move inversely to bond prices, just like a dividend stock. If the price of the bond goes down, you are earning a higher rate of return because you paid less. The opposite is true when bond prices go up. So, whenever you see the yield rise, the price of the bond is falling.
The second thing to know is that Treasury prices fluctuate with supply and demand. Treasury bonds are sold at auction initially, but they can also be bought and sold in the secondary market after they are issued. If there is a lot of demand, the bond will sell for a price above face value, which then lowers the yield. On the other side, if there is less demand, then the price of the bond will be lower and the yield will rise. At maturity, the government will pay back the face value of the security with interest.
Because Treasury bills are backed by the U.S. government, people view them as very secure. That’s why demand for Treasury bonds goes up (and consequently forces yields down) in times of economic uncertainty.
Securities with a long time horizon often have the highest interest rates. Investors demand a higher return if they have to wait longer until maturity. This gets us to what’s called the “yield curve.” The yield curve refers to the relationship between short-term yields and long-term interest yields. As we said, long-term bonds pay a higher yield than short-term bonds in a normal market. You can see a normal yield curve in the chart below.
In a healthy bond market long-term interest rates are higher than short-term rates. In other words, the yield curve slopes up. When this is the case, investors can expect a bigger reward for lending out their money for the long haul. The yield curve “flattens” when long-term and short-term rates are about the same, and it “inverts” when short-term yields rise above long-term yields. This inverted yield curve when 2-year bonds yield more than 10-year bonds has correctly predicted every recession over the past 50 years.
In fact, since 1956, every recession was preceded by an inverted yield curve. The folks at Bespoke note that when the 10/2-year yield curve inverts, there’s a more than 67% probability that the U.S. will fall into recession in 12 months and a more than 98% probability that a recession will occur in the next two years.
According to Bloomberg, the last persistent inversion of the Treasury yield curve occurred in 2006-2007 ahead of the 2008 recession.
As long as the yield curve remains inverted, we’re going to continue to have banking issues. And if there’s any failure in the banking system, it hurts all banks. This, then, hurts commerce, innovation, and something called the “velocity of money,” which is the measured rate at which money is exchanged in an economy.
The bottom line: An inverted Treasury yield curve has a considerable effect on the markets and the overall economy. This is why it’s critical the Fed does the right thing and finishes un-inverting the yield curve.
Where This Week’s Spike Came From
The culprit behind the 10-year Treasury yield’s spike this week was the March ISM manufacturing report. The Manufacturing PMI came in at 50.3% in March after contracting for 16 straight months. The New Orders Index and Production are also back above 50%. In addition, nine of the 15 manufacturing industries reported expansion in March.
While this should be considered good news, it raises concerns that the Fed does not need to lower rates if the economy is growing. And yet, Fed Chair Jerome Powell maintains that the central bank still plans to cut rates this year.
During a speech at Stanford University’s business school this week, Powell stated that “if the economy evolves broadly as we expect, most FOMC participants see it as likely to be appropriate to begin lowering the policy rate at some point this year.”
Personally, I expect the Fed to begin cutting rates in June. That, in turn, should take pressure off the Treasury yields and ultimately un-invert the yield curve.
However, a friend of mine, who is also an experienced analyst, has a different date in mind. So, I’ve invited him to join me for my Election Shock Summit (scheduled for Wednesday, April 10, at 8 p.m. Eastern time) so he can explain why.
He’ll also share the six words he expects to hear from Powell during the May FOMC meeting that could have a massive impact on not only the stock market but the presidential election. Plus, we’ll talk about how to protect your wealth even amid all the expected chaos.
Click here to reserve your spot for the Election Shock Summit now.
Sincerely,
Louis Navellier
Editor, Market 360
Article printed from InvestorPlace Media, https://investorplace.com/market360/2024/04/expect-more-chaos-if-the-fed-cant-fix-the-yield-curve/.


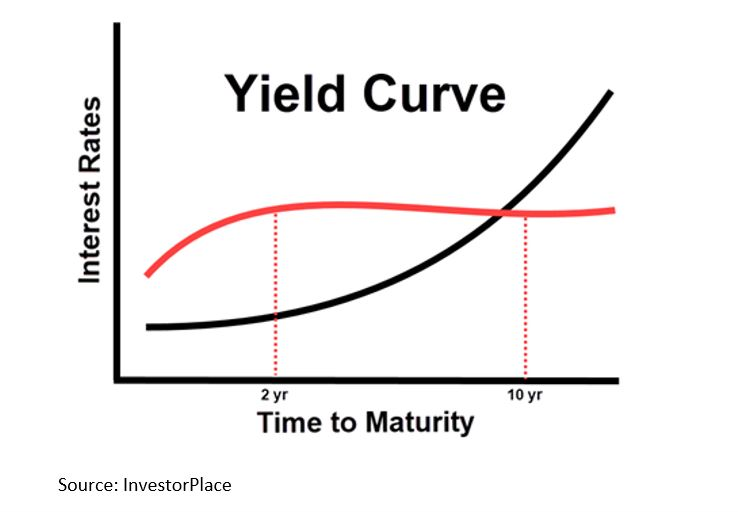 In a healthy bond market long-term interest rates are higher than short-term rates. In other words, the yield curve slopes up. When this is the case, investors can expect a bigger reward for lending out their money for the long haul. The yield curve “flattens” when long-term and short-term rates are about the same, and it “inverts” when short-term yields rise above long-term yields. This inverted yield curve when 2-year bonds yield more than 10-year bonds has correctly predicted every recession over the past 50 years.
In fact, since 1956, every recession was preceded by an inverted yield curve. The folks at Bespoke note that when the 10/2-year yield curve inverts, there’s a more than 67% probability that the U.S. will fall into recession in 12 months and a more than 98% probability that a recession will occur in the next two years.
According to Bloomberg, the last persistent inversion of the Treasury yield curve occurred in 2006-2007 ahead of the 2008 recession.
As long as the yield curve remains inverted, we’re going to continue to have banking issues. And if there’s any failure in the banking system, it hurts all banks. This, then, hurts commerce, innovation, and something called the “velocity of money,” which is the measured rate at which money is exchanged in an economy.
The bottom line: An inverted Treasury yield curve has a considerable effect on the markets and the overall economy. This is why it’s critical the Fed does the right thing and finishes un-inverting the yield curve.
In a healthy bond market long-term interest rates are higher than short-term rates. In other words, the yield curve slopes up. When this is the case, investors can expect a bigger reward for lending out their money for the long haul. The yield curve “flattens” when long-term and short-term rates are about the same, and it “inverts” when short-term yields rise above long-term yields. This inverted yield curve when 2-year bonds yield more than 10-year bonds has correctly predicted every recession over the past 50 years.
In fact, since 1956, every recession was preceded by an inverted yield curve. The folks at Bespoke note that when the 10/2-year yield curve inverts, there’s a more than 67% probability that the U.S. will fall into recession in 12 months and a more than 98% probability that a recession will occur in the next two years.
According to Bloomberg, the last persistent inversion of the Treasury yield curve occurred in 2006-2007 ahead of the 2008 recession.
As long as the yield curve remains inverted, we’re going to continue to have banking issues. And if there’s any failure in the banking system, it hurts all banks. This, then, hurts commerce, innovation, and something called the “velocity of money,” which is the measured rate at which money is exchanged in an economy.
The bottom line: An inverted Treasury yield curve has a considerable effect on the markets and the overall economy. This is why it’s critical the Fed does the right thing and finishes un-inverting the yield curve.
 Louis Navellier
Editor, Market 360
Louis Navellier
Editor, Market 360