


Editor’s Note: Yesterday, InvestorPlace CEO Brian Hunt reminded us that free markets, innovation, and productive enterprise have allowed mankind to achieve incredible progress despite wars, recessions, and bear markets.
Today, Brian picks up where he left off, sharing charts that show how – even during even the most severe stock market declines – American prosperity rises over time and markets eventually bounce back. Rather than letting our emotions take the wheel, we’re better off focusing on what really matters: progress.
Hello, Reader.
You know that for every one problem in America, there are thousands of brilliant people working on innovative solutions.
These are the types of people who invented the lightbulb… the television… the pacemaker… the airplane… and the iPhone.
They are people who have the brains and worth ethic to create incredible businesses like Starbucks, Facebook, Amazon, Whole Foods, Apple, Nike, and Google.
These companies have provided good jobs to millions of people… they provided goods and services to thankful customers… and they produced hundreds of billions of dollars in wealth for their shareholders. All by creating and innovating.
It’s been that way for centuries… and it will continue to be that way in the future.
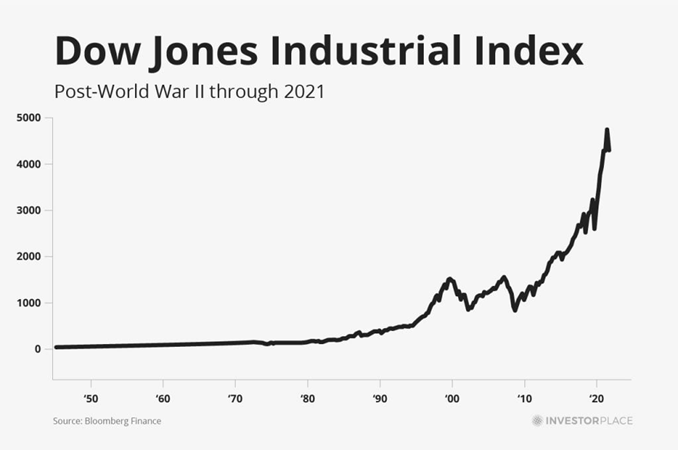
Below is a chart of the Dow Jones Industrial Index from post-World War II through 2021.
The stock market declines of 1987, 2000, and 2008 – while painful at the time – are just speed bumps on the long-term chart. And the takeaway is clear: Over time, American prosperity rises and the stock market goes up.
With this picture in mind, my advice is to “make the trend your friend” and ignore the naysayers. Don’t panic over a market correction and don’t let the fear-stoking headline of the hour scare you out of your holdings of high-quality innovative companies that are poised to change the world.
During stock market corrections, I ask you to focus on what really matters: progress, transformational industry trends, creating value for others, and innovation.
Remember that despite all the negative occurrences of the past 100 years, shareholders of innovative companies that serve their customers have made fortunes.
It’s been the surest way to get rich in America for more than 100 years. It will be that way for at least 100 more. That’s why staying bullish on human progress and innovation is at the foundation of what we do at InvestorPlace.
It’s also why, when our subscribers write in to ask if we have “bear market survival” plans, we send them this essay.
Our “bear market survival” plan consists of reviewing the facts above, thinking long-term, and looking to buy high-quality stocks at discount prices.
Our “bear market survival” plan does not consist of selling stocks in a panic.
I believe that when an investor can “deprogram” themselves from obsessing over “the market” and interest rates – and instead focus on the things above… the things that history has shown really matter – that investor ascends to a higher level of understanding when it comes to money and investing.
It’s one of the most important milestones on the journey to mastering money.
The Next Time You’re Tempted to Panic, Look at These Eight Charts
Since 1928, there have been 27 bear markets in the benchmark S&P 500 stock index. After each and every one of them, stocks went on to reach all-time highs. The track record here is perfect.
Recent history has eight outstanding examples of why a smart “bear market strategy” consists of keeping the facts in mind, thinking long term, and not getting scared out of stocks.
We like to think these eight charts are an antidote to a harmful financial disease we call “Short-Term-itis.”
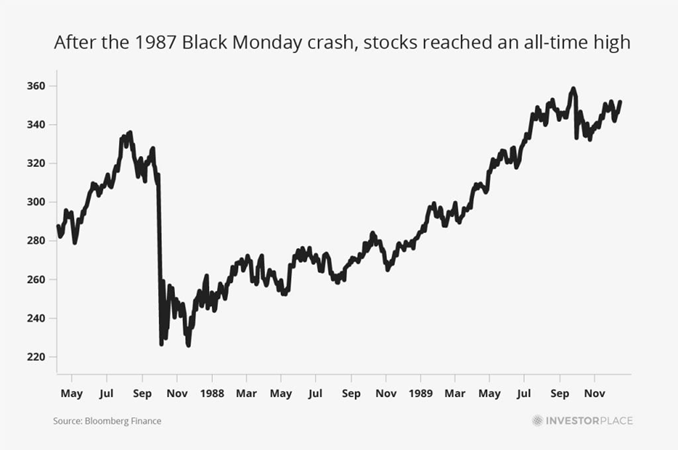
For example, during the famed 1987 “Black Monday” crash, the stock market dropped 33.5% in a single day. It caused a short-term global financial panic.
However, less than two years later, the stock market reached an all-time high.
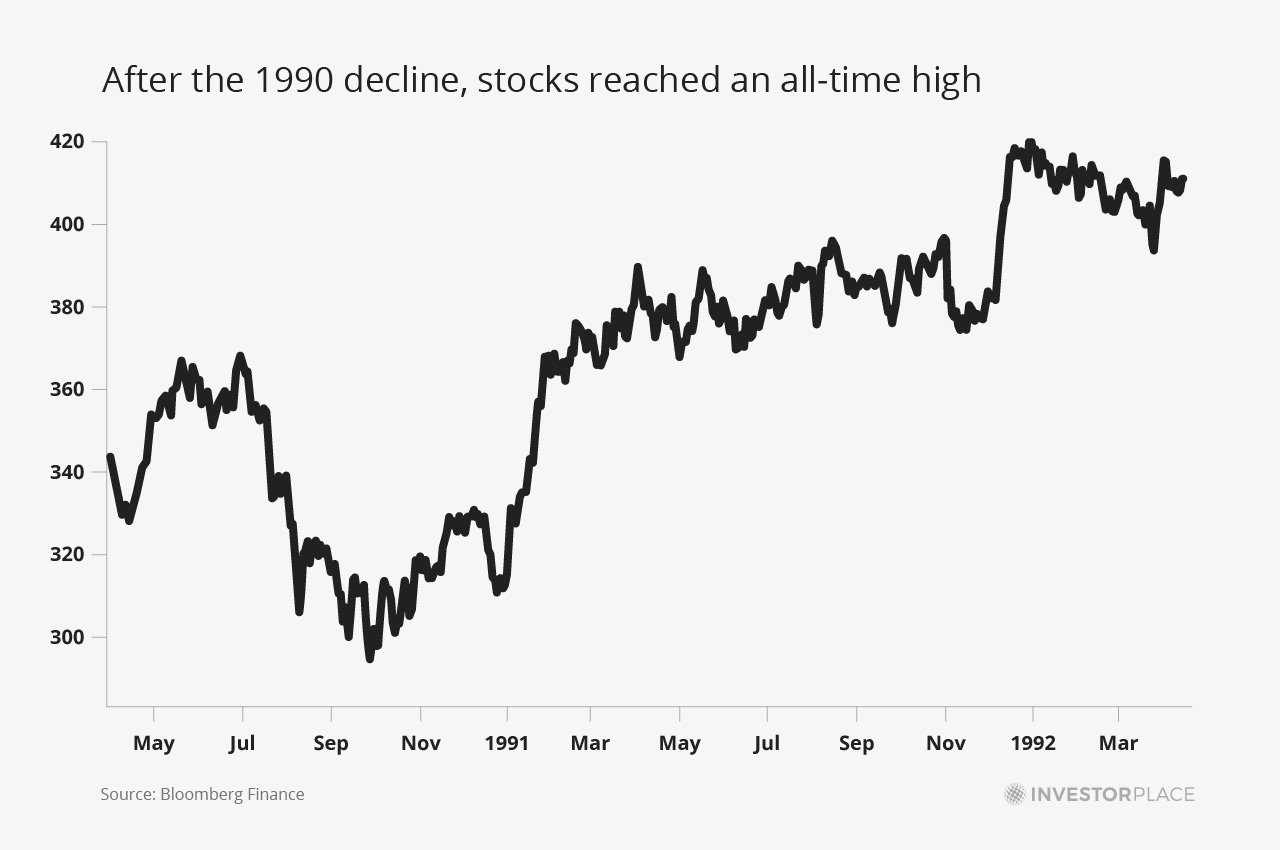
Then you have the big stock market decline of 1990, which was created by worries over a U.S. recession and the Gulf War. Stocks fell 19.9% during this decline. However, stocks recovered and hit a new all-time high less than a year later.

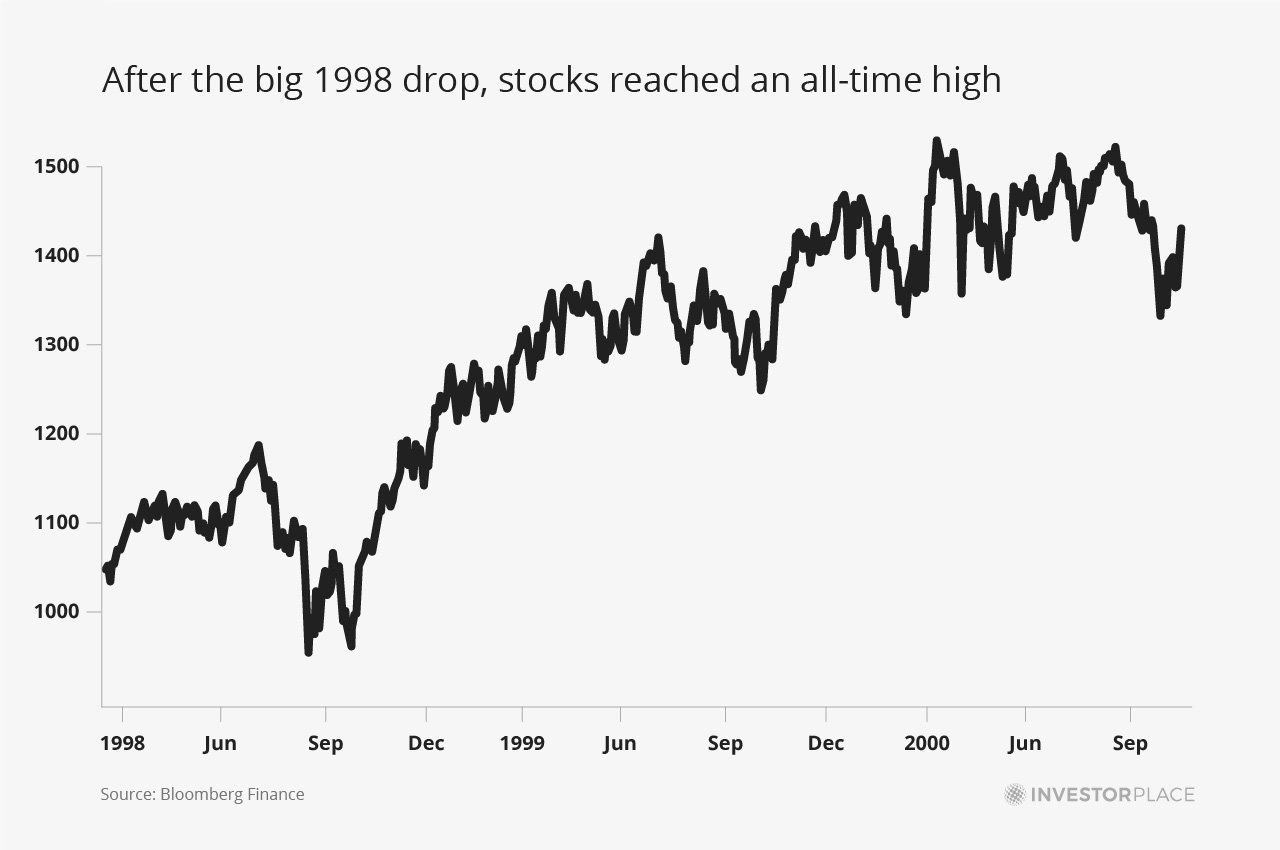
Then you have the big 1998 market decline. Stocks fell 19.3% over the span of a few months. Stocks quickly recovered and reached a new all-time high by early 1999.

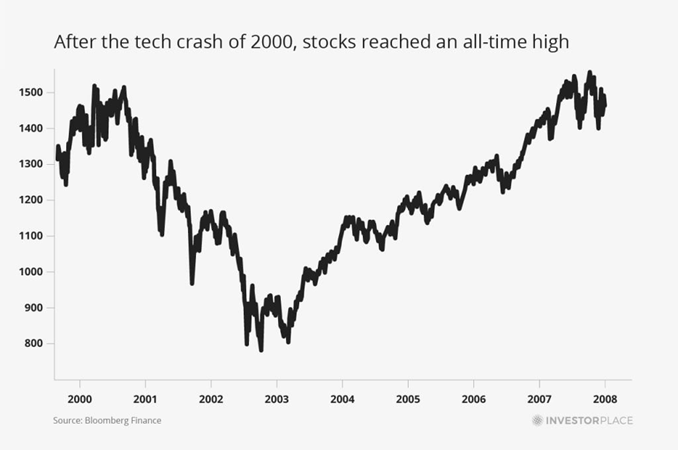
Then you have the 2000-2002 bear market. This crash came after the dot-com boom reached its frenzied peak in March 2000. Although this was one of the worst market downturns in U.S. history, stocks went on to recover and reach new all-time highs in 2007.
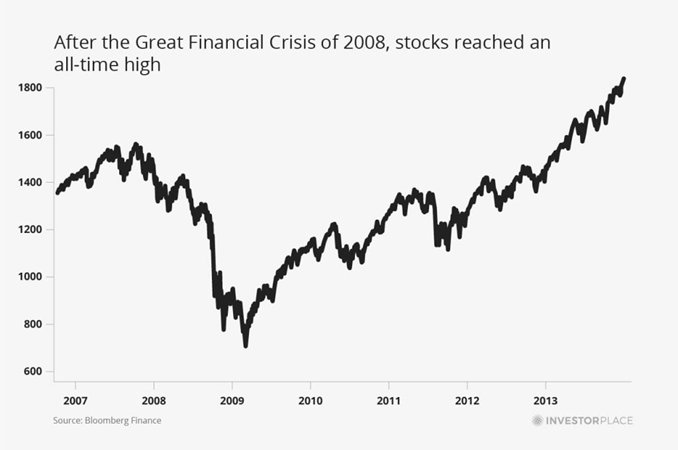
Next, you have the stock bear market that accompanied the Great Financial Crisis of 2008. Stocks fell an incredible 56% during the decline. However, stocks went on to recover and entered a historic bull market that lasted a decade. Fortunes were made during the recovery, and the market reached a new all-time high in 2013.
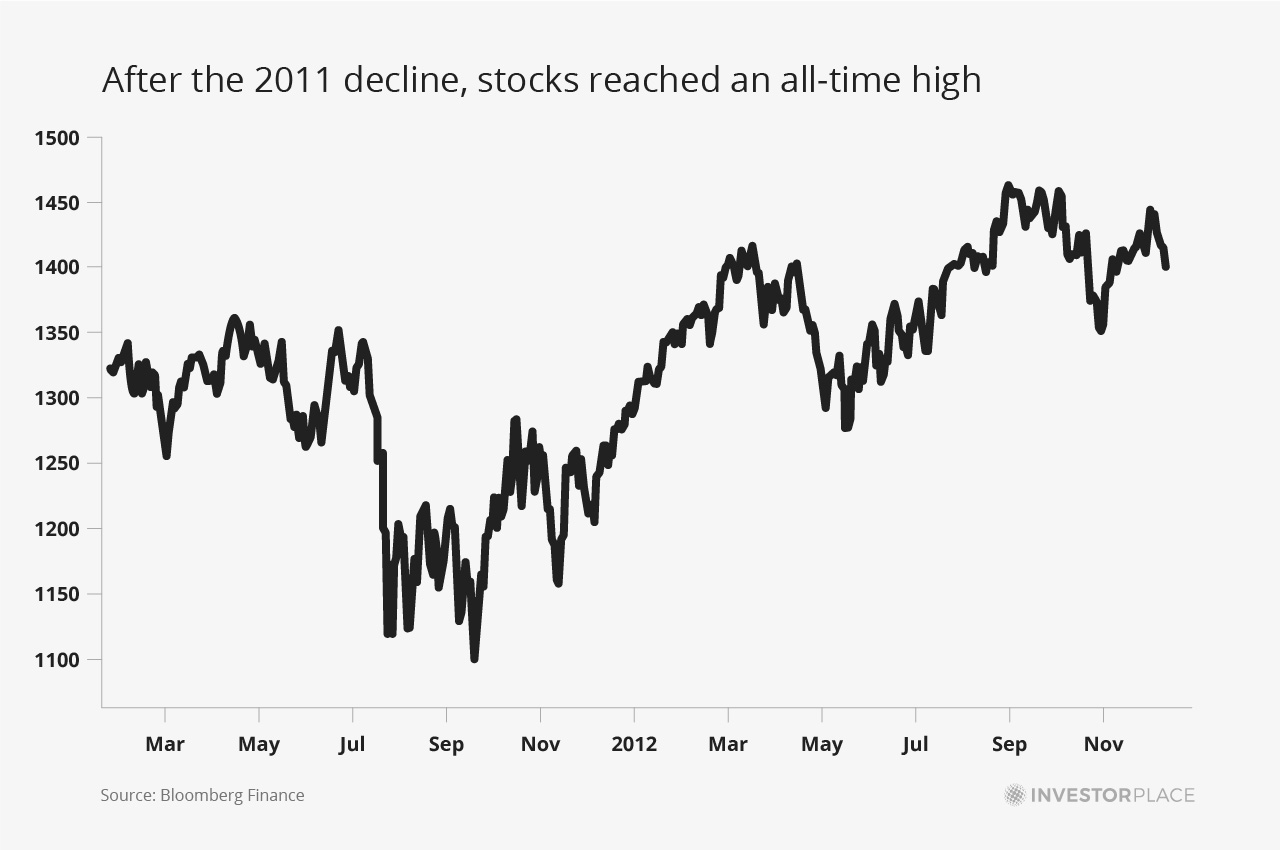
In the midst of the decade-long recovery that followed the 2008 crash, the market saw a decline of about 19% in late 2011. Stocks recovered and reached a new all-time high by early 2012.

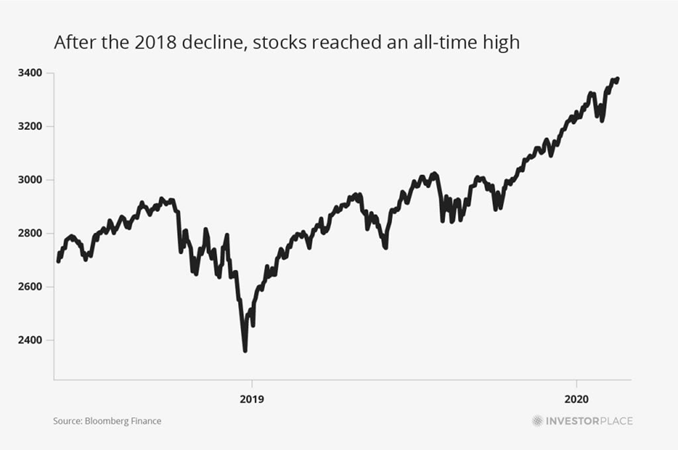
In 2018, the market suffered a gut-wrenching decline of 19%. But by the summer of the following year, stocks had recovered and reached another new all-time high.
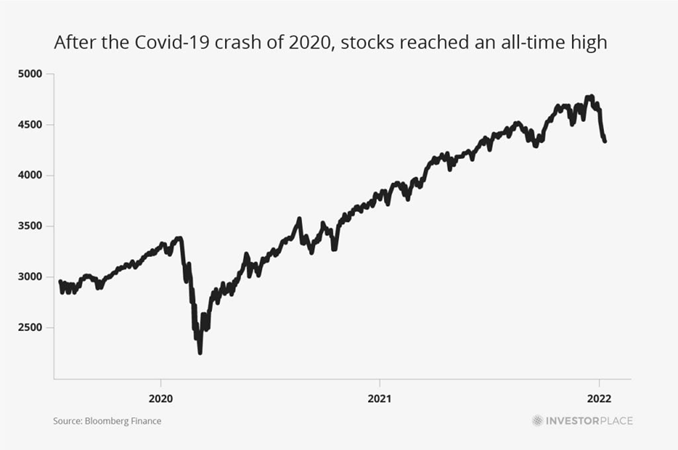
Then there is the pandemic stock market drop and recovery of 2020. When the world realized Covid-19 was a serious worldwide problem, the market fell 53% in less than two months. However, government stimulus helped the market recover, and stocks reached a new all-time high by the end of the year.
Summing Up
You’ve just gone on a tour of the biggest financial disasters of the past 60 years.
You’ve reviewed the most famous, most horrible bear markets and stock crashes in history… like the Black Monday crash of 1987… the dot-com crash of 2000… and the Great Financial Crisis of 2008.
You’ve also seen the track record here is perfect. Each period of rough times was followed by all-time highs.
These recent recoveries highlight a very long trend…
Every major stock market correction, every crash, every bear market in American history has been followed by new all-time highs.
That’s why we state once again… for emphasis…
During stock market corrections, focus on what really matters: progress, transformational industry trends, creating value for others, and innovation.
Remember that despite all the negative developments of the past 100 years, shareholders of innovative companies that serve their customers have made fortunes.
Remember that it pays to bet on America.
Remember that a wise “bear market survival” plan consists of reviewing the facts above, thinking long-term, and staying long stocks.
Regards,
Brian Hunt
CEO, InvestorPlace