Known for its wild and volatile rallies, Inovio (NASDAQ:INO) is a hot commodity in the trading world. Particularly for those that enjoy trading stocks tied to the novel coronavirus. While INO stock has struggled over the past week, shares are still up huge this year.

Specifically, the stock is up more than 500% so far in 2020. Any good news tied to its Covid-19 treatment and this name could blow through its prior highs from June. On the flip side, any sustainable negative news could crush the stock too.
So where does that leave investors? In the same binary situation they’ve always been in when dealing with Inovio. Before we dive any deeper, let’s get a look at the charts.
Trading INO Stock
Click to Enlarge
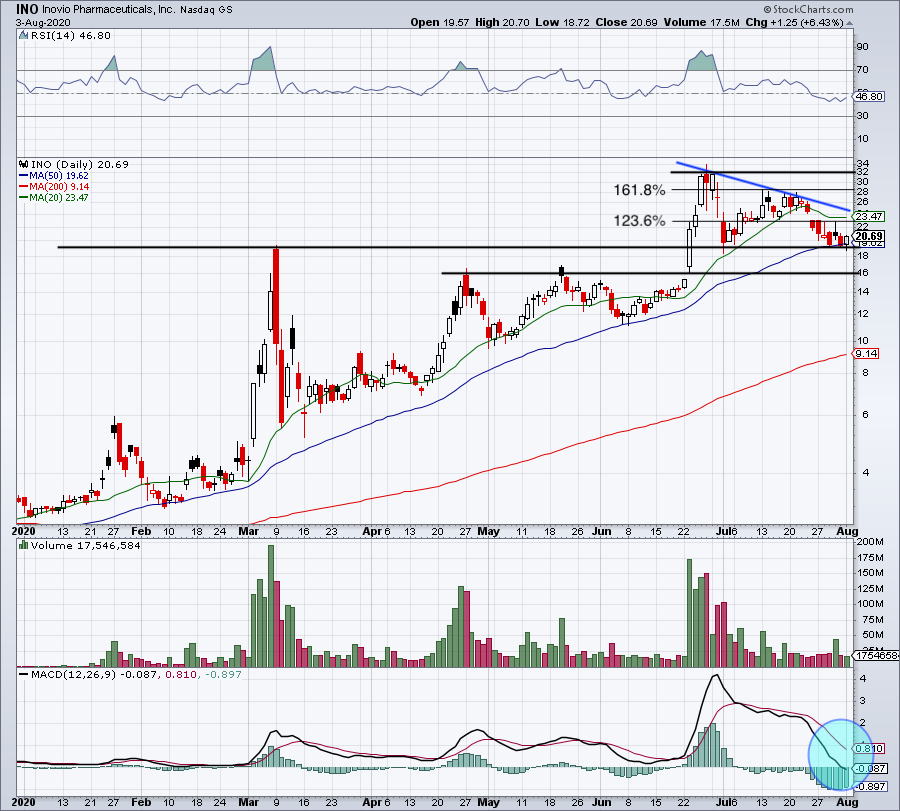
In late June, INO stock went on a monster rally, ripping more than 100% in just a few days. Shares topped out in the $32 to $34 area before pulling back. At the time, the 20-day moving average became support.
That was until mid-July when Inovio broke below this mark. The pullback now leaves investors at an interesting spot.
On the one hand, shares are holding up at the 50-day moving average and the prior high from March near $19.50. On the downside, it has no meaningful momentum at the moment, something that’s highlighted by the MACD (blue circle).
I am not ragingly bullish on the chart, but I am more bullish than bearish. Shares are holding the prior high, the 50-day moving average and the 10-week moving average. We’ve had a nice pullback from the June highs, while the 50-day has been solid support over the past few months.
However, we need to see some rotation higher off of these levels. Specifically, I want to see INO stock reclaim the 10-day moving average near $21.50. Above puts $23.50 in play, which would put a rally up to the 123.6% extension and 20-day moving average on the table.
Apologies on the heavy technicals here, but this is how Inovio trades. Ultimately, I want to see a move over downtrend resistance (blue line). That would put the 161.8% extension in play near $28 — which most recently acted as resistance — followed by the $32 to $34 area.
On the downside, if we get a breakdown below the 50-day moving average through the two-week low at $18.76, it puts $16 in play. Below that and INO stock can suffer a larger decline.
Breaking Down INO Stock
Long story short on the technicals, over the 20-day moving average and downtrend resistance could propel shares higher. Below $18.76 puts $16 in play. In the case of Inovio, I prefer to lean on the technicals over the fundamentals. That’s as the fundamentals have evaporated to some degree.
Revenue fell off a cliff from 2018 to 2019, dropping from $30.4 million to $4.1 million. The company has not been profitable for years, while free cash flow remains in negative territory.
On the plus side, Inovio recently took the step to shore up its balance sheet. The company now boasts $275.5 million in current assets, decimating current liabilities of $32.3 million. The move effectively removed its net debt situation, (although Inovio still carries almost $100 million in total debt).
Earlier I mentioned the binary nature of INO stock and that remains the case. If this name plays a role in finding a treatment for Covid-19, the stock has upside. If it doesn’t, it has downside. It’s as simple as that.
On July 30, shares rallied as much as 17.7% on encouraging preclinical results. However, shares could not hold onto a bulk of those gains, closing higher by “just” 6.4%.
Where to from here? Well, that depends on the outcome of the trials. The company is expected to begin Phase 2 and Phase 3 human trials sometime this summer. Even the beginning of these trials could act as a catalyst, depending on the climate of the overall market.
For now, I will continue to let the technicals guide me on Inovio. They simply outweigh the fundamentals at this point.
Bret Kenwell is the manager and author of Future Blue Chips and is on Twitter @BretKenwell. As of this writing, Bret Kenwell did not hold a position in any of the aforementioned securities.