Using the forward P/E ratio and estimates to ballpark the S&P … are analysts accurately predicting earnings? … how investor sentiment could impact the outcome
On Friday, the S&P briefly fell into a bear market before staging an impressive rally at the end of the session.
So, what now?
Well, first, the market is overdue for a rally. We could be seeing the beginning of it today.
Whether it ends up being a true, bullish reversal that will last or just a bear-market rally, we don’t know.
But with that in mind, today let’s look at two oddly specific possibilities for what the S&P does in the coming months (which we’ll explain).
In short, we’ll look at the potential for it soaring by 32%…or falling another 16%.
Let’s jump in.
***One of the most widely used stock-market valuation metrics is the price-to-earnings ratio (P/E)
It’s likely you’re very familiar with this ratio, but let’s make sure we’re all on the same page.
Here’s the P/E ratio visually.
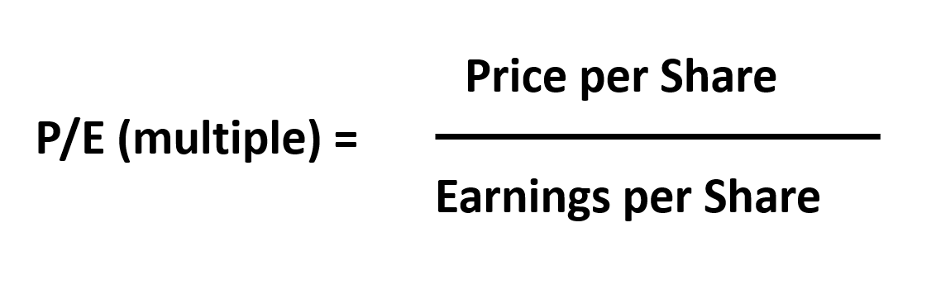
With a traditional P/E ratio, investors take a stock’s current price, then divide it by its earnings. That gives us the P/E multiple.
Investors then compare this multiple to the long-term average P/E multiple for the S&P 500, which is 16 (15.97, to be exact).
This comparison reveals whether the S&P is under- or overvalued relative to history.
For example, as I write Monday, even after weeks of heavy selling in the S&P, its P/E ratio is at 19.8, according to Multpl.com.
Translation – the S&P is still overvalued relative to its historical average of 16.
***The problem is this backward-looking P/E ratio is of limited value because it uses old earnings data
In other words, the P/E ratio tells us if the market was under- or overvalued.
But Wall Street is forward-looking. We want to know what’s coming because that’s what’s going to drive prices tomorrow.
Enter the “forward” P/E ratio.
It’s the same calculation as above, but we use analysts’ guesses at what earnings will be 12 months from now.
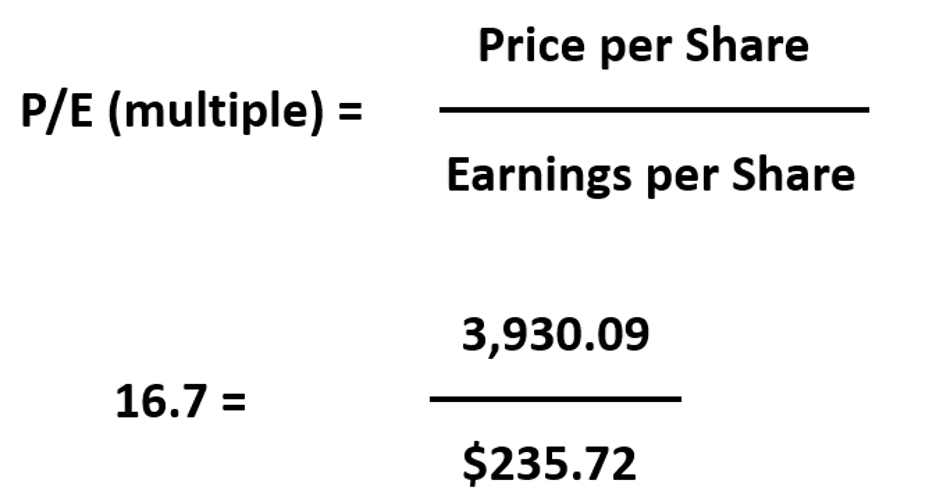
Last week, the S&P’s forward 12-month consensus earnings estimate from Bloomberg rose to $235.72 per share.
So, given the S&P’s price – 3,930, as I write – that gives us a forward P/E of 16.7.
Here’s the equation, followed by the math:
So, if the long-term average P/E ratio is 16 and the forward P/E ratio is clocking in at 16.7, that’s good news, right?
Isn’t it showing us that, based on forward-looking earnings, the market is fairly valued? So, hopefully, that means the selling pressure will back off?
Maybe.
It depends on whether or not you think analysts have accurately predicted future earnings.
***How accurate are forward earnings estimates?
It varies.
But it seems that in recent years, forecasts often come in a bit low on a quarterly basis. However, on a 12-month forecast, they’re usually too high.
Investopedia reports that, on average, forward earnings estimates are about 10% higher than where earnings actually come in.
Some studies put the number far higher.
For example, a paper written in 2016 called An Empirical Study of Financial Analysts Earnings Forecast Accuracy put the overestimation at 25%.
From the paper’s abstract:
Over the past 12 years, financial analysts across the world have been optimistically wrong with their 12-month earnings forecasts by 25.3%.
…analyst earnings forecasts globally were 25.3% optimistically wrong, meaning on average, analysts started each year forecasting company profits of US$125, but 12 months later that company reported profits of US$100.
So, off the bat, we should eye forward 12-month earnings estimates with some suspicion. But now, let’s factor in the headwinds of today.
As you know, last week we saw stock-price meltdowns from both Walmart and Target due to disappointing earnings.
Here’s CNN providing more color on Target:
The retail giant reported a stunning 52% drop in profit for the first quarter, badly missing Wall Street’s forecasts.
The company blamed higher expenses due to continued supply-chain disruptions. Consumers also are holding back on nonessential purchases because of rampant inflation.
Shares of Target plunged 25% Wednesday, its worst day since 1987.
***With earnings running into the headwinds of supply-chain problems and inflation, are analysts trimming estimates aggressively enough?
FactSet is the go-to earnings-data analytics company used by the pros. Here’s what they just found about supply-chain problems:
Given the concerns in the market about supply-chain disruptions, did more S&P 500 companies than normal comment on supply chains during their earnings conference calls for the first quarter?
The answer is yes.
FactSet Document Search (which allows users to search for key words or phrases across multiple document types) was used to answer this question.
Through Document Search, FactSet searched for the term “supply chain” in the conference call transcripts of all the S&P 500 companies that conducted earnings conference calls from March 15 through May 19.
Of these companies, 338 cited the term “supply chain” during their earnings calls for the first quarter, which is well above the 5-year average of 199.
In fact, this is the third-highest number of S&P 500 companies citing “supply chain” on earnings calls going back to at least 2010…
Now, despite this, FactSet reports that analysts are calling for calendar-year 2022 earnings growth of 10.0%. Plus, they report that, since March 31, the forward 12-month EPS estimate has increased by 1.9%.
I don’t have a crystal ball, so I can’t say these analysts are wrong. But does it feel like we’re entering a double-digit earnings-growth environment?
Remember – we have to look forward, not backward. Yes, we’ve been in a double-digit growth environment. The economy and the consumer exploded out of the pandemic.
But is that where we’re going?
Also, given the complexities of making an earnings forecast in such historically unusual market conditions (worst inflation in 40 years, unique supply-chain problems, war in Europe…) should we be a bit more cautious?
Other investors are asking that same question.
From Bloomberg
:
For months, market optimists have convinced themselves that earnings would buttress the stock market from 40-year-high inflation and surging interest rates.
In their view, resilient consumer demand would keep sales strong, but few counted on persistent supply chain snarls that can lead to empty shelves one month and gluts the next.
Now, analysts are revisiting those assumptions, but they’re likely just getting started in earnest, and they haven’t even begun to process the possibility of a full-blown recession.
But let’s forget earnings estimates for a moment. Let’s return to the P/E ratio and analyze it from a different angle to see if we can take a stab at where the S&P will go.
(I know, we haven’t gotten to our 32% up or 16% down forecasts…they’re coming.)
***Let’s transpose the P/E ratio to see what might happen if bearish sentiment truly grips investors
As noted above, here’s our P/E ratio formula:
But if you recall sixth-grade math, we can flip this equation around to isolate a different variable.
In other words, rather than trying to solve for “P/E,” what if we assume we know it, and then solve for “price per share” instead?
That rejiggered formula is just:

Basically, we’re asking: “If we assume that earnings forecasts are accurate, and we assume we know what the multiple is that investors will be willing to pay, what will the S&P’s price be in a year?
This question puts a spotlight on investor sentiment as measured through the P/E multiple.
This is important – remember, in a roaring bull market, investors feel great and are willing to pay super-high multiples for the same earnings as, say, a year earlier.
But in crashing, bearish markets, investors run for the hills. The price they’re willing to pay for those same earnings might be far lower.
The proxy for this shifting investor sentiment about price is the P/E multiple.
Now, as you know, the average long-term P/E multiple is 16. Emphasis on “average.”
Clearly, P/Es can drop far lower than average if bearish sentiment grips market participants.
So, let’s do a new calculation.
Let’s say that one year from now, all of the craziness in the world (we can now add “monkeypox” to that list) sours investors. This means they’re only willing to pay a P/E multiple of 14 rather than the historic average of 16.
***What does that suggest for the S&P 500’s price?
Before we answer, remember, the following calculation assumes that analysts’ forward earnings estimations prove to be accurate, which you know isn’t usually the case.
Nevertheless, below is our rejiggered formula, followed by the math:
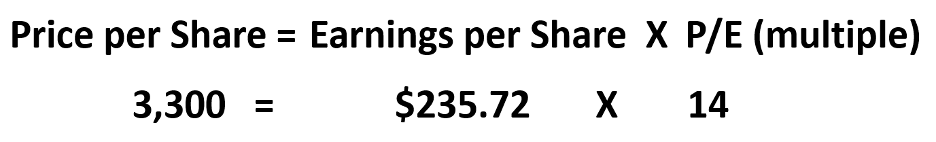
The S&P at 3,300 would be 16% below its level as I write.
To be clear, I’m not predicting this. I’m trying to illustrate the potential downside based on sentiment, even if earnings live up to the hype.
Obviously, if 12-month earnings come in lower, as history suggests they often do, that would bring down the S&P’s value even more.
***On the other hand, when the analysts crunch their numbers, what are they suggesting for the S&P’s price in 12 months?
Let’s jump back to FactSet:
The bottom-up target price for the S&P 500 is 5128.62, which is 31.5% above the closing price of 3900.79.
I should point out that this 5,128 price-target is about 6% higher than the S&P’s all-time high.
So, in our first hypothetical, investors get bearish and the market drops 16% from here.
Driving this possibility is increasing investor fear… continued war between Russia and Ukraine… lingering inflation that impacts consumers… economic sluggishness due to rising interest rates… elevated fuel costs, which eat into margins… continued supply-chain disruptions… and now, monkeypox, and what could be escalating tensions with China over Taiwan.
Or…
We have the analysts calling for 32% gains over the next 12 months (technically, it’s a 30.5% gain from levels as I write).
Driving this possibility is a market that’s down 19%-ish from its all-time high… the hope that peak inflation is behind us… the hope that supply-chain problems are mostly in the rearview… the hope that fuel prices retreat, despite a potential European ban on Russian oil… and the hope that consumer spending remains strong enough to support the economy even as the Fed raises rates to stop inflation.
So, which will it be?
Well, as I’ve written before, I don’t have a crystal ball. And odds are that the real outcome lies somewhere in the middle.
That said, I will point out that one of these outcomes relies on “hope” far more than the other.
***A quick reminder before we wrap up
Tomorrow at 4 PM, Louis Navellier is hosting a special, live event called the Great American Wealth Shift.
We’ll bring you more details in tomorrow’s Digest, but in short, Louis’ quantitative-based computer programs are signaling a huge directional change in money flow.
From Louis:
Just as money is fleeing one industry… I’m predicting billions are about to flow into another, making a lot of people wealthy.
As you might imagine, positioning your wealth in the path of this huge flow of dollars can be a massive tailwind for your portfolio.
Tomorrow, Louis will explain his system, provide the details of the market conditions it’s registering today, and he’ll even reveal two specific stocks poised to surge from this wealth shift. To reserve your seat, click here.
Have a good evening,
Jeff Remsburg