Is this recent bullish push sustainable? … why today’s selling pressure is good … eight reasons from Luke Lango to be cautiously optimistic
As of last Friday’s close, over the last five trading sessions, the S&P has tacked on nearly 7%.
Equally impressive, each day saw positive price action.
Today, the markets gave back some of last week’s gains. But I’m going to argue that’s actually a good thing for the overall health of this recent bullishness.
In this Digest, let’s look at recent price action in the S&P from a technical perspective. Then we’ll pivot to our hypergrowth expert Luke Lango who provides not one, but eight reasons why last week’s bullishness could, in fact, be the beginning of the reversal we’ve all been waiting for.
***What is the S&P’s chart telling us about the recent rally?
From the beginning of the year through mid-March, the S&P slumped. Falling in a series of lower highs and lower lows, it gave up about 13%.
But then it exploded north, tacking on roughly 11% over about two weeks.
At the time, many talking heads were quick to proclaim that the selling pressure was over and it was back to blue skies. Here in the Digest, we were more skeptical.
From our March 25th Digest:
So, is this bullishness a genuine trend reversal and the start of sustained gains?
Or is it a head-fake? A fleeting relief rally that will fizzle out as the bears resume control?
What makes the answer difficult is that the recent gains we’ve enjoyed have not been gradual and tested by small pullbacks. It’s just been an explosive, sudden burst north.
It’s easier to feel confident about a true market reversal when you see a gradual bottoming-out process, followed by some small moves north that are tested and hold, followed by a series of higher highs and higher lows.
All we have now is a massive move north. That doesn’t mean this gain can’t hold. It just means it hasn’t been tested yet.
Well, as we now know, that rally fizzled and the bulls lost.
From the peak of that March rally through the low from a couple weeks ago, the S&P fell another 16%.
But then came the rally we highlighted at the top of this Digest.
So, what are we to make of this latest bullishness?
***As of last Friday, it appeared to be déjà vu all over again
Have you ever decided to lose weight by eating healthy and exercising? Perhaps you threw yourself into it by eating nothing but salads, coupled with daily exercise for a few weeks, only to burn out and revert to old, bad habits within a month or two.
If so, you’re one of millions who have experienced something similar.
Because this boom/bust pattern is so common, nutrition experts recommend a more tempered approach – give yourself permission to have some “cheat days” with your diet.
Plus, a less aggressive exercise routine is often preferable. After all, two days a week in the gym for six months is better than six days a week in the gym for only two weeks.
Point is: Slow and steady – but sustainable – wins the race. Too much, too fast often burns out.
March’s rally wasn’t slow and steady. And as of last Friday, neither was May’s.
Both times, it’s been a manic, near-vertical buying frenzy off of a key support level.
(That’s why today’s selling is a good thing. More on this point shortly.)
Below, we look at the S&P since spring 2021. I’ve highlighted what “slow and steady” looks like from last spring and summer.
Notice the more gradual slope. Also notice the many small pullbacks along the way, in which gains are digested.
Compare that with the March rally, which was vertical and largely untested by any pullbacks.
Then look at the recent May rally, which has also largely been vertical and untested – until today.

If this is a true bullish reversal, we want to see some down days this week when the market stumbles, attracts new buyers, then climbs higher – the classic “higher highs and higher lows” pattern.
That’s why today’s selling pressure is good. A bull market that’s just a straight shot north is fragile. And what goes up fast can come down even faster. Seeing the market digest recent gains, trade sideways for a day or two, then continue to climb is much healthier market action than just “up.”
Keep your eyes on this.
In the meantime, let’s turn to Luke to see why this recent bullishness might be the beginning of a sustained reversal in the market.
***The other side of the valley is within sight
For newer readers, Luke is InvestorPlace’s hypergrowth expert and editor of Early Stage Investor. He focuses on cutting-edge technology innovators and disrupters that are transforming our world – and have the potential to radically transform a portfolio.
Last week, in his Early Stage Investor Daily Notes, Luke addressed whether the recent surge in the market means the bearishness is behind us.
Below, we share Luke’s thoughts. Usually, we italicize the font when we quote our experts. But Luke has so many valid points I want to include, I don’t want to risk over-italicizing which might make it harder for you to read.
So, here’s Luke in normal font; I’ll circle back in a moment:
While we aren’t going to emphatically say “yes” just yet, we are going to say that for the first time in the 2022 market selloff, we can see the other side of the valley.
That is, things are finally shaping up for a massive market rebound by the summer.
First, there’s the positive price action. We’ve now registered three big “up” days for the market in a row, which is impressive. More impressive are the underlying dynamics of these rallies. They’re very “risk-on.” Growth and tech are leading the way. Hypergrowth stocks are surging. For reasons we’ve previously discussed, these are very healthy market internals.
Second, there’s the slowing inflation data. For the first time since late 2020, inflation is slowing. The year-over-year inflation rates in both the PCE and CPI dropped in April, with many economists now calling March “peak inflation” and projecting inflation deceleration throughout the summer.
Third, there are the falling yields. All year long, Treasury yields have been surging, putting downward pressure on equity valuations. But over the past few weeks, yields have been steadily dropping, and technically speaking, the all-important 10-year Treasury yield appears to be forming a topping pattern.
Fourth, there’s the dovish evolution of the Fed. The Federal Open Market Committee (FOMC) minutes released this week confirm that this Fed is ready and willing to pause rate hikes after July to re-assess economic conditions at that time. In response, the futures market has sliced a whole rate hike over their 2022 expectations for the Fed Funds rate by December.
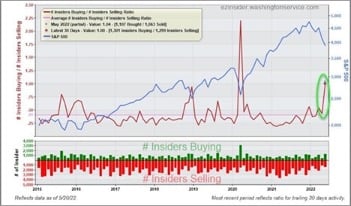
Fifth, there’s all this insider buying. The insider buy-sell ratio has hit its highest levels since March 2020, and is spiking to levels historically consistent with market bottoms.
Sixth, there’s the improving supply chain situation. The New York Fed’s Global Supply Chain Pressure Index has shown continued improvement in supply chain disruptions over the past few months, and the China COVID-19 lockdown situation appears to be moderating, setting the stage for further supply chain improvements in the coming months.
Seventh, there’s the commodity price pullback. Commodity prices have been spiking all year long. Now, they’re retreating, and they’re retreating across the board by fairly sizable margins.
Eighth, there’s the technical picture. Technically speaking, this market has shown pretty robust support right at the bear market entry level for the S&P 500, which speaks to the buying pressure for stocks below current levels.
***Jeff here again
Clearly, there’s a growing list of reasons to be encouraged by today’s market.
And as to today’s pullback, remember, that’s actually what we want. Seeing the S&P fall and attract an influx of new buyers would show that other investors are seeing the same strengths that Luke highlights.
By the way, a moment ago, Luke mentioned how growth and tech stocks are leading the way in this rally. Let’s dig into this just a bit more.
I’m looking at Luke’s Early Stage Investor portfolio (top-tier growth and tech stocks) at the end of Tuesday’s session.
Here’s a snapshot of the performance of a handful stocks in Luke’s “1,000% Divergence Window” sub-portfolio since mid-month.
If you’re having trouble seeing it, there are gains of 24%, 29%, 32%, and 35%.
Source: StockCharts.comTo Luke’s point, when market conditions turns bullish, these top-tier hypergrowth stocks soar. And as we saw beginning last spring, when conditions sour, these stocks are the first to suffer.
The fact that we’re seeing this type of explosive price action from tech innovators is a bullish sign we don’t want to ignore.
We’ll keep you updated.
Have a good evening,
Jeff Remsburg