The silver lining in inflation data … good news in the bond market … why a yield-curve inversion might be good for stocks … a mild recession? … a new stock pick from Louis Navellier
Twelve months from today, where will the S&P be?
Got your answer?
If we go by history, it will be 16.07% higher.
That answer probably raises an eyebrow for at least a few readers. After all, what about inflation, a possible recession, and a weakening consumer?
Earlier this week, legendary investor Louis Navellier tackled all of this in his latest issue of Accelerated Profits.
Let’s jump in with Louis highlighting the positive interpretation of the recent CPI inflation report.
After acknowledging June’s scorching Consumer Price Index reading of 9.1% year-over-year…and the even worse Producer Price Index of 11.6%…Louis zeroed in on something positive:
Clearly, inflation is still hot, hot, hot.
But here’s what we need to remember: Core inflation has moderated since its peak back in March.
Core CPI peaked at 6.5% in March, and it dipped to a 6% annual pace in May and a 5.9% annual pace in June.
Core PPI peaked at 7.1% in March, and it declined to a 6.7% annual pace in May and a 6.4% annual pace in June.
For any readers less familiar, “core” CPI excludes food and energy costs, with the rationale that these expenses have heightened volatility.
***How declining core CPI and core PPI will help keep bond yields under control
When inflation is blazing hot, bonds suffer.
After all, if you own a bond that’s paying you, call it, 3% interest, but inflation is climbing to 5%, 6%, 7%, or beyond, the purchasing power of your bond-income stream is collapsing.
So, as inflation rises, bond investors sell first and ask questions later.
Now, remember the inverse relationship between bond prices and bond yields. When investors sell bonds, that pushes down bond prices…which pushes up bond yields.
Rising bond yields, particularly the 10-year Treasury bond, has been responsible for lots of the pain in the economy and stock market in recent months.
For example, mortgage rates take their cue from the 10-year Treasury yield. As the 10-year climbs, so too does the 30-year fixed mortgage rate.
You can see this relationship below. The 10-year Treasury yield is in green. The 30-year fixed rate mortgage is in black. Notice how their shapes are highly correlated.

Now, let’s circle back and connect some dots…
- If core CPI and core PPI are easing, that will take pressure off overall inflation rates.
- If inflation isn’t coming in as hot, that means less pain for bondholders.
- If bondholders feel less pain, they won’t be as quick to sell bonds.
- Decreased bond-selling-pressure will limit how high bond yields climb…
And contained bond yields are good for the economy and stocks.
As you can see in the chart above, this pullback in the 10-year Treasury yield has been happening since last month.
Let’s go back to Louis:
As long as the core CPI and PPI continue to decline, the Treasury bond rally that has been underway since mid-June should persist.
The 10-year Treasury yield has dropped from its 3.5% peak in mid-June to just under 3.0% today.
As I write Wednesday, the 10-year Treasury yield sits right at 3%. This is good news – let’s cross fingers it continues.
***The additional bullish aspect of falling Treasury yields
Next in his update, Louis points out that the falling 10-year Treasury yield has helped invert the yield curve.
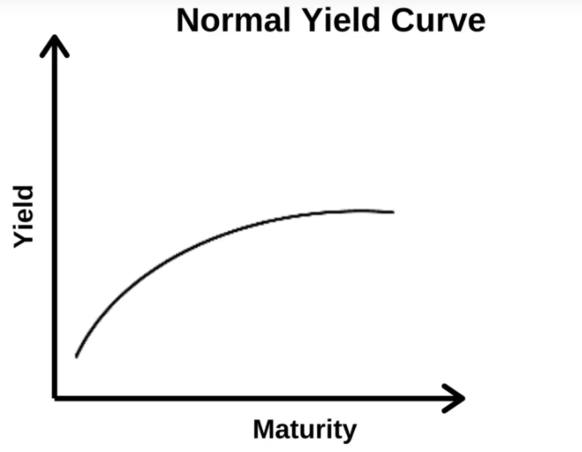
To make sure we’re all on the same page, a yield curve is a graphical representation of the yields of all currently available bonds – from short-term to long-term.
In normal times, the longer you tie up your money in a bond, the higher the yield you would demand for it. So, you’d expect less yield from a two-year bond and more yield from a 10-year bond.
Given this, in healthy market conditions, we usually see a “lower-left” to “upper-right” yield curve.
But when economic conditions become murky and investors aren’t sure what’s on the way, this can change. Specifically, uncertain economic times tends to flatten the yield curve.
And if the yield curve actually inverts, history has shown that it serves as a highly accurate predictor of recessions, though the timing of those recessions is varied.

With this context behind us, let’s return to Louis:
[The dip in the 10-year Treasury yield] has inverted the yield curve, which could prove to be a very positive development for the stock market in the upcoming months.
Before we keep on with Louis, let’s address the obvious pushback…
“Wait, you just told me that an inversion often leads to a recession. How is that a ‘positive development’ for anything?”
We’ll address the recessionary implications in a moment. We’re not ignoring that.
As to stocks, keep in mind that there’s nearly always a lag-time between a yield-curve inversion and subsequent pain in the economy and/or stock market. And in that lag-time, history shows that stocks often outperform.
Here’s Louis with the details:
According to the folks at Bespoke, in the previous 17 times that the three-month to 10-year yield curve flattened by 100 basis points in 50 trading days since 1971, the S&P 500 has rallied in the next three months, six months and 12 months.
Breaking it down, the S&P 500 has posted a median gain of 0.27% in three months, a 4.26% median gain in six months and a 16.07% median gain in 12 months.
In other words, if history repeats, the S&P 500 may essentially tread water until early October and then stage a nice year-end rally that should continue in 2023.
***But what about the U.S. consumer? Aren’t there signs that consumers are running into trouble? And how might that influence a recession?
This answer is important, since consumer spending accounts for roughly 70% of the entire U.S. Gross Domestic Product. So, that directly relates to recession risk.
Here’s Louis:
The recent retail sales report also showed that consumers are still willing to spend in the current environment.
Retail sales rose 1% in June, slightly better than economists’ estimates for a 0.9% increase. May’s retail sales were revised to show a 0.1% decline, compared to the previously reported 0.3% rise.
Gas-station sales rose 3.6% in June due to higher prices at the pump, but excluding gas stations, retail sales still rose a healthy 0.7%.
In my opinion, the June retail-sales report paints a picture of a healthy consumer, so some economists may revise their second-quarter GDP estimates.
Bottom line: All of the recession talk by Wall Street strategists has been exhausting – and it’s overdone!
Whatever recession fears linger, they are not as acute as they have been due in part to a strong retail sales report for June.
So, since there is no earnings recession and the labor market remains healthy, I think if there is a recession, it is very shallow and a weird one.
Put all this together, and it paints the picture of economic and stock-market conditions that aren’t nearly as bleak and dire as they’ve appeared at points this year. As you can tell, Louis is actually feeling quite optimistic.
***It turns out, Louis isn’t the only veteran investor feeling bullish about today
Whitney Tilson is another investing legend, having been named “The Prophet” by CNBC. And like Louis, Whitney is seeing reasons for bullishness today.
Yes, investors should be prepared for volatility as we finish out the summer, but both Whitney and Louis believe investors are staring down an opportunity to make five- to ten-times their money through a massive turning point in the market. In fact, they’ve been dripping out new stock recommendations over the last several days.
On Monday, Whitney posted a new pick. About the selection, Louis said: “An opportunity like this comes along once every 20 years.”
It turns out that tomorrow, Louis is releasing his own recommendation. It’s a semiconductor play that he’s incredibly excited about. Louis believes it has 1,000%+ potential.
To learn more about what Louis and Whitney are seeing, and to access their recommendations, click here.
I should point out that, combined, these two legends have recommended 37 different stocks for gains of 1,000% or more over the course of their careers. We’ll be watching to see if 38 and 39 come from their latest picks.
Have a good evening,
Jeff Remsburg