A “100% accurate” market indicator … what it’s saying about today’s conditions … the foundation of Luke Lango’s trading service … how the “macro” and “micro” are aligning today
I’m looking for an indicator with a 100% hit rate.I don’t want any uncertainty.The 2022 bear market was too violent and too bloody for me to accept any room for error. I want certainty, certainty, certainty, and a little bit more certainty – with a side of certainty, if they’ll let me have it.
That comes from our hypergrowth expert Luke Lango.Now, I want certainty too – we all do. But the idea of “certainty” when it comes to investing raises an eyebrow, at a minimum.Well, Luke just produced some fascinating research that demands we at least consider this idea. It’s an indicator that has a track record of 100% accuracy going back to 1950. And today, it’s suggesting we’ve entered a new, robust bull market.In this Digest, let’s dig into the research, look at what it means for upcoming market returns, then discuss the best way to position ourselves.It’s all a precursor to a special live event that Luke is holding today at 4 PM ET. There’s lots to cover, so let’s jump right in.
Is this the closest thing to “guaranteed” in investing?
Investors are always looking for an edge, some indicator or system that gives them a sneak preview about what’s coming.There are countless such indicators. One of the best-known in technical circles is a Golden Cross.This is when a shorter-term moving average (MA) crosses over a longer-term moving average. The most widely-referenced Golden Cross is when the 50-day MA pushes north through the 200-day MA.Here’s more from Luke:
Usually, [a Golden Cross] is bullish. The operative word there is “usually.” Golden crosses are usually bullish. They aren’t always bullish. Since 1950, the S&P 500 has experienced 36 different golden crosses. About 80% of the time, stocks are higher a year later, with an average return of about 10%.
These are good odds, but Luke takes it further…He analyzed historical data to determine what happened when a Golden Cross occurred at a price that was more than 10% off all-time highs.This has happened 16 times since 1950, and Luke found that in 15 of those instances (94%), stocks where higher a year later with an average return of 16%.Clearly, these are fantastic numbers, but not 100%.And this leads us to Luke’s quest for certainty that opened today’s Digest.
While such a thing seems impossible, even laughable, the historical data suggest otherwise
Luke narrowed down his Golden Cross inputs even further.He evaluated what happened when the 50-day MA crossed the 200-day MA and remained above it for at least three days. And this must have happened after the 50-day MA has been below the 200-day MA for at least nine months prior (suggestive of a long bear market).Between 1950 and 2022, this “Super Golden Cross,” as Luke calls it, has triggered only eight times.Here are the results:
…It’s infallible.It isn’t 80% or 90% accurate. Going back to 1950, it has a 100% accuracy of predicting bear market endings and bull market beginnings. No false signals. 100% accuracy. And average peak returns a year later were huge, on the order of nearly 25%!
Below are the returns. You can evaluate for yourself.

As we noted earlier, Luke reports that we recently triggered a Super Golden Cross.This alone is huge news. We have an indicator with a perfect track record, suggesting an average of 24% gains are in the works for the broad market.
How do we improve upon that?That brings us to this afternoon’s event.
The foundation of Luke’s trading approach to the markets
A principle called “stage analysis” is the foundation of Luke’s approach to trading.In short, a stock is always in one of four unique stages: 1) going sideways at a bottom, 2) going up, 3) going sideways at a top, or 4) going down.Stage analysis is the science behind figuring out which of these four stages a stock is in at any given point in time.
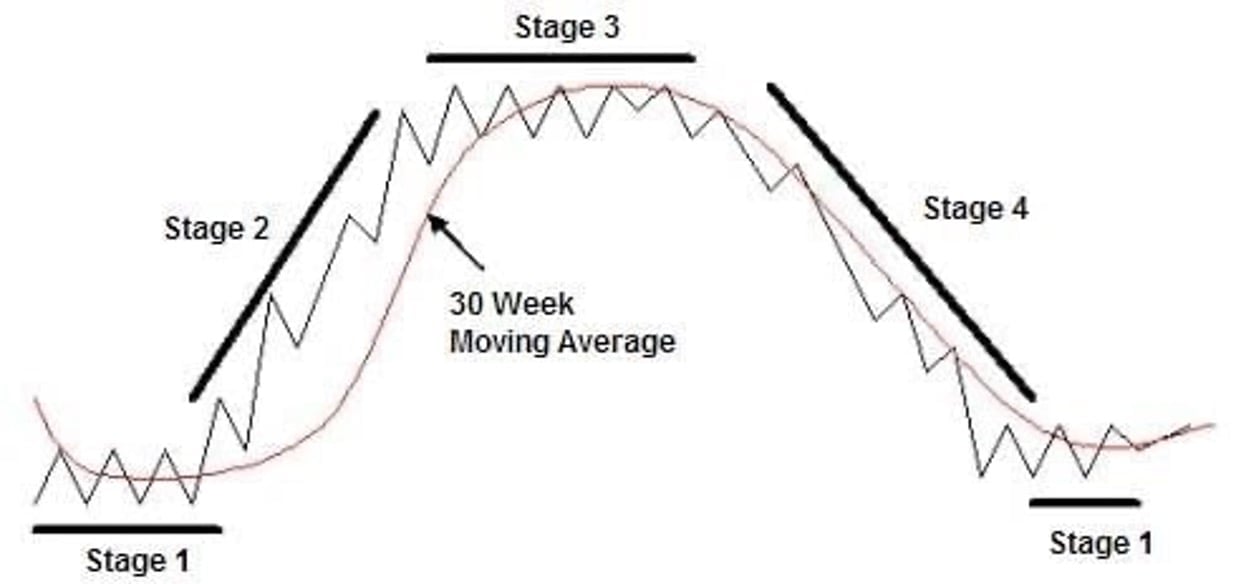
The key to profiting through shorter-term trading is by correctly identifying Stage-2 breakouts and exiting as a Stage-3 sideways pattern turns into Stage-4 declines.So, this is exactly what Luke and his team did. They created a computer system programmed to find stocks on the cusp of entering a Stage 2 “break out.”The model scans the entire U.S. stock market every single week, checks every stock against a set of parameters consistent with a Stage-2 breakout, and returns the stocks that fit the profile.Interestingly, one of the parameters the model searches for is a version of the Super Golden Cross that we discussed a moment ago.
One of the benefits of this trading style is that it identifies stocks that are climbing regardless of what the broad market is doing
Whereas a buy-and-hold investor might watch his portfolio suffer if the prevailing market sentiment is bearish, a stage-analysis-trader can zero in on specific breakout stocks that are climbing while the broader market languishes.“There’s always a bull market somewhere” is a phrase you’ve likely read here in the Digest when we make this point. However, while this is true, when you trade “against the grain” of the broad market, you often face at least a partial headwind.Consider a hedge fund manager who sees stage analysis trade surging, despite a bear market. She might want to invest, but if her other positions are down, she might not want to lock in losses to free up trading capital. Or perhaps she’s just anxious because of the broader bearishness and prefers to sit on the safety of cash.This creates a type of opportunity cost wherein the returns of an against-the-grain trade may not be maximized.But when the broad market is bullish, that’s when stage analysis trading gains can snowball as sentiment and macro/micro momentum align.Tying this Digest together now, Luke’s research suggests the “macro” is now becoming bullish. The 100% accurate Super Golden Cross has provided that forecast.Meanwhile, Luke’s stage analysis system is engineered to find the “micro” bullishness – in other words, the specific stocks that are surging, regardless of what the broad market is doing.But to date, Luke’s system has had to operate in a broadly bearish market – the macro and micro have conflicted. Despite that, the system has performed impressively.What happens now that the broad market appears to finally be turning bullish?Here’s more from Luke:
Already, even in a rocky environment, the system is crushing it – and we just now entered a bull market. I mean, last week, our system found a tiny stock that none of our analysts had ever heard of – and now, it’s already up about 12%. Last month, it found an AI stock that popped 40% in about a week. Before that, it found a resources stock that soared 45% in just a few weeks and a biotech stock that roared 100% higher in a little over a month. Point being: This system works. And it repeatedly produced those types of gains, even in a bear market. Imagine what it will be capable of during a fortune-making bear-to-bull transition…
This afternoon at 4 PM ET, Luke will be diving into all the details of this. He’ll be talking breakout triggers… bull market conditions… stage analysis trade returns… how to find attractive trade candidates… and far more.It’s a free event. Just click here to reserve your seat.Here’s Luke with the final word:
This afternoon, we are unveiling our top quantitative trading system. We use this system to consistently find the fastest-moving and highest-flying stocks on Wall Street for quick gains. At today’s event, we are giving you an exclusive chance to gain direct access to this system and its breakout stock picks. It could be your key to scoring huge returns in 2023 – and beyond.
Have a good evening,Jeff Remsburg