Gold shines as geopolitical conflict escalates … the rising 10-year Treasury yield and strong dollar aren’t slowing it down … be ready for a pullback … the long-term picture is bullish
Let’s begin with a callback to our February 6th Digest:
Perhaps no other asset benefits from global tension as much as gold. As we’ve been covering in the Digest, the situation in the Mideast is deteriorating quickly…
While we hope this situation does not escalate, if it does, it will only help gold prices.
Cut to the following three headlines yesterday:
Washington Post: “Israeli strike on Iranian Consulate in Damascus kills key commander, Iran says”
AP News: “Iran vows response after strike it blames on Israel demolishes consulate in Syria”
CNBC: “Gold shatters new records as Mideast tensions add to bullish mix”
To make sure we’re all on the same page, earlier this week, an Israeli airstrike in the Syrian capital of Damascus hit a building next to Iran’s embassy
Two senior members of Iran’s Islamic Revolutionary Guard Corps were allegedly killed.
In response, Iran’s Supreme Leader Ayatollah Ali Khamenei said, “We will make them regretful about the crime and similar acts.”
One of Iran’s proxies, Lebanon’s Hezbollah militia, issued similar saber rattling: “This crime will certainly not pass without the enemy receiving punishment and revenge.”
Nervous investors are now weighing the prospect of wider conflict in the Mideast – potentially one that drags in the U.S.
Here’s Bloomberg on that note:
Monday’s attack on the IRGC in Syria was not like Israel’s war in Gaza. The targets were carefully chosen and hit with the highest possible level of precision.
Yet the risk is significant that the shadow war it was part of could now develop into a much wider and more direct conflict that sucks in larger powers.
Many will look to US President Joe Biden to stop that, but whether it happens is up to Khamenei…
[He] now has the most consequential choices to make. He should choose wisely, because this is a fight that he picked and although it had so far cost him little, that’s starting to change.
If he overreacts, the fighting will leave the shadows entirely and become a much larger war he could lose.
In the shadow of these growing fears, gold has set the latest in a string of recent all-time highs.
Yesterday, spot gold hit $2,276.89, a new record, only to top it this morning when the yellow metal reached $2,288.09.
What’s noteworthy about this latest climb is that it’s happening despite the recent fears of a slower-moving Fed and today’s strong dollar
As we noted in yesterday’s Digest, recent economic reports show that the U.S. economy is re-strengthening.
The latest such report came this morning when the ADP jobs report topped expectations. The data showed that companies added 184,000 workers in March, more than the forecast of 155,000. This is the fastest growth since last June.
This economic strength is resulting in reinflation fears, causing traders to pare back their bets on interest rate cuts from the Federal Reserve this year.
This should be bad news for gold. After all, gold offers investors no dividends or cash flows. So, interest rates that remain “higher for longer” should represent an opportunity cost, luring some investors out from gold, into bonds.
As I write, the 10-year Treasury yield has jumped to 4.40%. That should be kryptonite for gold. But like the 1970s, we’re seeing both bond yields and gold rise together.
Similarly, the yellow metal should be running into headwinds based on today’s strengthening dollar.
When the dollar is stronger, it requires fewer of those strong dollars to buy the same volume of gold. All things equal, this should drive down the dollar-denominated price of gold.
But here again, this isn’t what we’re seeing.
Below, we look at the U.S. Dollar Index. It’s a measure of the value of the U.S. dollar relative to the value of a basket of six major global currencies – the euro, Swiss franc, Japanese yen, Canadian dollar, British pound, and Swedish krona.
As you’re about to see, it has recently climbed back to its February high. If it breaks this resistance level, then we’d likely see the dollar push toward its double-top from last fall.

But while gold’s recent strength is impressive, if you’re not already in this trade, be careful about initiating a new position at this moment
That’s because gold’s RSI and MACD charts show a stretched trade.
For newer Digest readers, the Relative Strength Index (RSI) is a momentum indicator that measures the extent to which an asset is overbought or oversold.
A reading over 70 suggests an asset is “overbought” (and likely poised to pull back as traders take profits) while a reading below 30 means it’s “oversold” (and poised for gains as bargain-hunters step in and buy).
Below, we look at gold’s RSI. There are two things to notice.
First, it’s at 79, which is extreme nosebleed territory.
Second, barring the even-higher RSI reading last month, we’d have to travel back to January of 2023 to find a similarly elevated level. And following that bout of a stretched RSI, gold’s price fell roughly 7%.
We arrive at the same conclusion when analyzing gold’s MACD.
The Moving Average Convergence/Divergence (MACD) indicator reflects changes in a price trend’s strength, direction, momentum, and duration. Traders use this tool by analyzing the location of the MACD line relative to its signal line.
At its most basic interpretation, if the MACD crosses above the signal line, it’s considered a bullish crossover, and potentially a buy signal. The opposite is true as well.
Consideration is also given to whether the MACD and signal line are trading above or below the zero line. The farther the MACD and signal line are from zero, the more stretched prices are in that direction.
As you can see below, the MACD is blown out to the upside. The last time it reached similar levels, gold’s price bled off roughly 10% over the following six months.
While gold’s price could certainly defy these stretched indicators, we’d be foolish to ignore them.
But while we prepare ourselves for a correction and/or a stretch of consolidation, let’s maintain broader perspective on why gold’s bull run is likely nowhere close to done.
Despite trading at all-time highs, gold remains historically undervalued relative to the S&P 500
Here’s our macro expert Eric Fry, editor of Investment Report, to explain this headscratcher:
…The cost of implementing a gold hedge has rarely been cheaper than it is today.
As the chart below shows, the price of the XAU Index, relative to the S&P 500, hit a new all-time low [about one month ago]. Using price-to-EBITDA valuations, instead of price, the XAU is merely close to all-time lows.
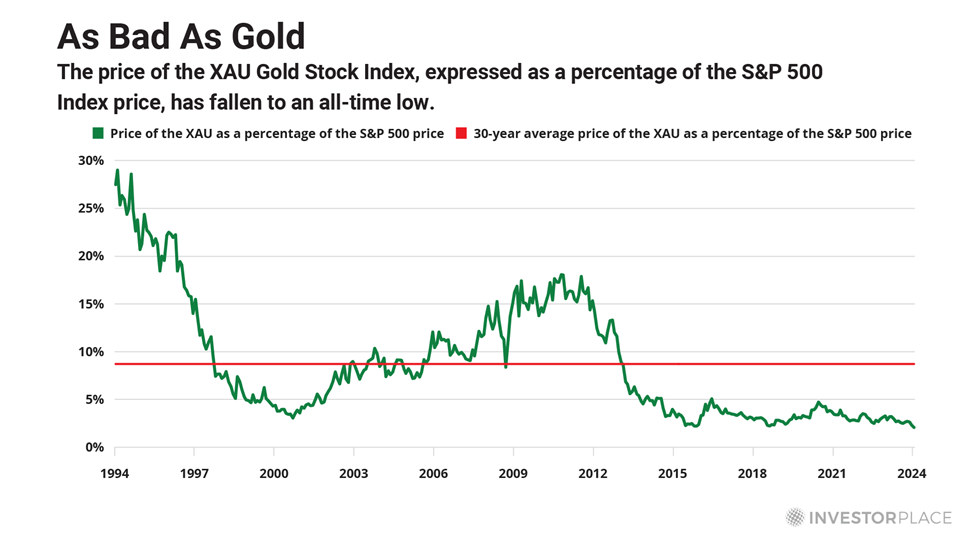
Obviously, these extreme pricing and valuation disparities do not guarantee that gold stocks will soon begin closing the gap between themselves and the S&P 500. But they do suggest that the gold market is offering an attractive entry point, at least for a trade.
For example, if the XAU Index merely traded up to its average valuation, relative to the S&P 500, it would triple!
This attractive trade set-up is why Eric added two new gold plays to his Speculator portfolio on March 21st. It hasn’t been even two full weeks since that recommendation, yet the two positions are up, respectively, 46.44% and 52.61% as I write Wednesday morning.
Congrats to the Speculator subscribers on this jackrabbit start.
Before we wrap up, let’s highlight one final aspect of Eric’s research on gold
From November 2000 to November 2010, the Nasdaq went nowhere. It was a losing decade.
Yet over that same period, gold stocks soared more than 450%.
Now, we’re not making the claim that we’re in for another lost decade on Wall Street, or that gold stocks will repeat that same degree of outperformance.
But as we’ve noted in prior Digests, you ignore gold at your own risk. Thousands of years of history have shown it to be a powerful portfolio diversifier, wealth preserver, and during certain windows of time, even an explosive wealth generator.
And circling back to the top of today’s Digest about the Mideast and broadening tensions, here’s this morning’s headline from The New York Times :
“Fears Grow That Syria Strike Could Spur Retaliatory Attacks on Israel and U.S.”
While we hope such an outcome doesn’t come to pass, this is the exact reason why we own gold.
Here’s Eric to take us out:
Given the bullish factors that are aligning behind the gold price, the yellow metal seems likely to deliver some upside surprises over the coming months…
So, is the precious metal a good investment?
The short answer: yes.
Have a good evening,
Jeff Remsburg