Why Jonathan Rose is shorting tech stocks… the market forecast from the seasonality tool… how to trade a gold breakout… Eric Fry says “Sell Tesla”
Veteran trader Jonathan Rose is betting on one (or both) of the following two scenarios playing out over the next two weeks:
- Tech stocks fall
- Volatility jumps
From Jonathan’s Divergence Trader Trade Entry Alert yesterday:
With the front end of the VIX Term Structure sitting under the 15 mark, the market appears dangerously complacent heading into a week packed with catalysts.
Between the Fed’s rate decision, inflation data, employment numbers, and earnings from the biggest names in tech, there’s little room for error.
To make sure we’re all on the same page, the VIX, often called the market’s “fear gauge,” tracks expected volatility over the next 30 days based on options pricing.
When Jonathan mentions the “term structure” of the VIX, he’s referring to how volatility is priced over different time frames, similar to a yield curve but for investor fear.
Right now, the front end of that curve – the near-term outlook – is sitting below 15. This is a level historically associated with calm, confident markets. In other words, traders aren’t expecting much turbulence in the short term.
But looking at the calendar, this week is littered with potential landmines:
- Earnings from Meta and Microsoft tomorrow
- The FOMC meeting tomorrow
- The ADP employment report tomorrow
- Earnings from Amazon and Apple on Thursday
- The Personal Consumption Expenditures (PCE) report on Thursday
- Trump’s tariff deadline on Friday
- The U.S. unemployment report on Friday
Despite these potential shocks, traders are pricing in a calm market.
Here’s Jonathan with why this is a problem, and what he’s recommending:
If even one domino falls—whether it’s a hawkish Powell, a hot jobs report, or disappointing guidance from Apple or Amazon—the VIX could spike and pressure the broader market.
To position for that risk, we’re entering a defined-risk put spread on QQQ [the Nasdaq ETF], targeting a move lower into August.
This new put spread setup lets us profit from rising volatility or a short-term pullback, while keeping our exposure capped and our capital efficient.
What’s interesting about this trade is that Jonathan doesn’t necessarily need tech stocks to fall to make money.
Buying a put when volatility is low means you’re paying less for the option. If volatility later rises – even if the stock ends near the same price – the increased option value from that volatility alone can make the put profitable.
Bottom line: Jonathan doesn’t need a big price drop, just a rise in uncertainty. And if he gets both? Even better.
This kind of creative thinking is why we’re so pleased that Jonathan has joined our InvestorPlace team.
To get a better sense for Jonathan and his trading, join him for his free Masters in Trading Live broadcasts at 11:00 a.m. Eastern time every day the market is open. They’re a fantastic way to learn more about trading, while also giving you the tools to put a wad of cash in your pocket.
Jonathan’s outlook mirrors the forecast from TradeSmith’s seasonality tool
Short-term bearish…medium-term bullish.
That’s what historical market data and the TradeSmith seasonality tool suggest for the S&P 500. I’ll show you this in a moment.
First, to make sure we’re all on the same page, last Tuesday, legendary investor Louis Navellier and TradeSmith CEO Keith Kaplan walked through TradeSmith’s “seasonal trading tool.” It highlights the exact days to buy and sell a stock based on that stock’s unique, historical “seasonal” patterns.
It shows you – visually – a stock’s historical trend line. You can use it to get a better sense for what historical data suggests is coming for the stock, index, or commodity that you’re tracking.
Below is a chart showing what the seasonality tool is forecasting for the S&P.
The S&P’s price line is blue. The aqua line is the S&P’s seasonal trend line using data from the last 15 years.
If you’re having trouble seeing the chart, here’s the takeaway: History suggests that the S&P is peaking (for the moment) this week. We face volatile yet declining prices overall, until October 2.
From there, the S&P rebounds and makes a strong run through December 2.
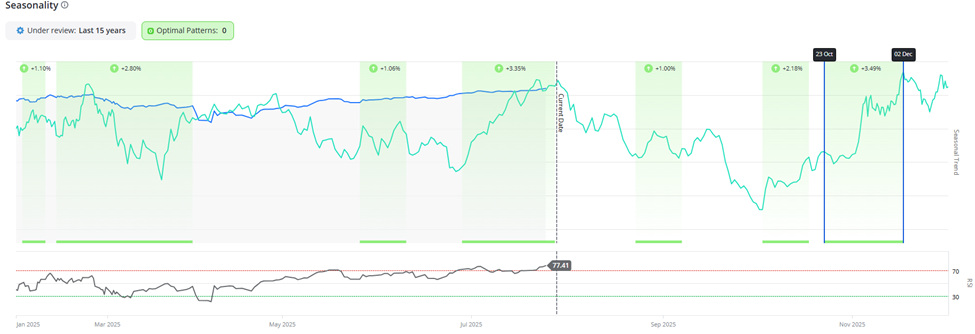
You’ll also notice the timeframe that’s bookended by two blue lines (on the right side of the chart above).
The seasonality tool notes that this period from October 23 through December 2 features the following statistics (over the last 15 years):
- Average return +3.49%
- Annualized return +36.80%
- Largest drawdown -5.64% in 2020
- Largest gain +8.95% in 2023
So, here’s our takeaway using this tool: Go short or sit on the sidelines until October, then pivot and go long until early December.
To see the seasonality tool in action, click here to catch the free replay of Louis and Keith from last week. A heads-up that we’re taking down the video tomorrow evening, so if you’ve been meaning to watch it but haven’t found time, we’re nearing last call.
A gold breakout is coming
Beginning in January, the yellow metal began a steady march higher, setting a series of new all-time highs.
However, since peaking in late April at $3,432, gold has been trading sideways, unable to break through resistance at the general $3,430 level.
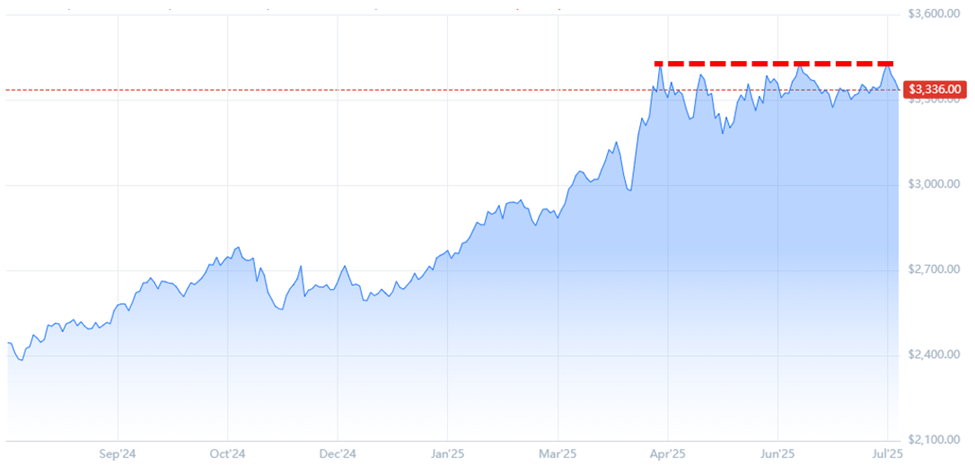
Gold is setting up a bullish “ascending triangle” technical formation. This is a popular pattern used in technical analysis to identify potential breakout opportunities. It’s bullish, suggesting that an existing uptrend will likely continue after the pattern completes.
Below, I’ll show you how this looks. The triangle is completed by a flat upper resistance line and an upward-sloping lower trendline.
This upward-sloping trendline is important because it indicates that buyers are becoming more and more aggressive, willing to buy at progressively higher prices.
Here’s how this looks for gold since the pattern began in April…
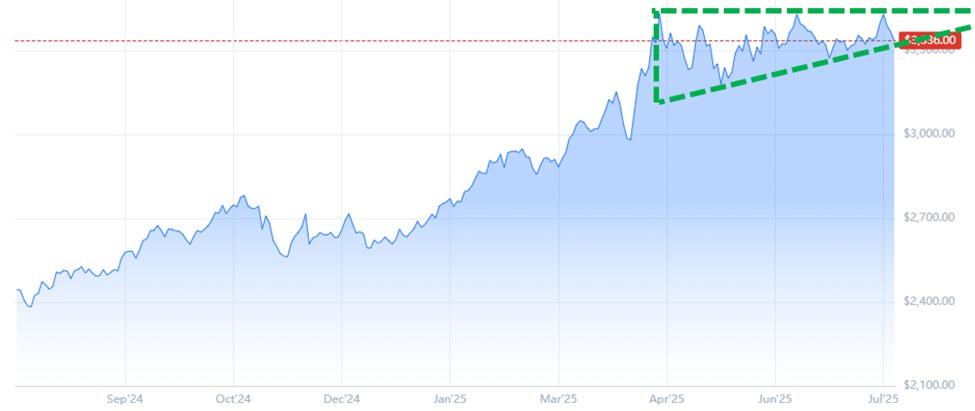
To trade this pattern, wait for gold to break definitively above the upper resistance line around $3,430.
By the way, a breakout is consistent with what the seasonality tool predicts for gold.
Here’s Keith:
Here’s what our Seasonality tool forecasts for gold in the coming months.
Gold has two green days coming up, back-to-back – starting right as the S&P 500 enters its bearish pivot point:
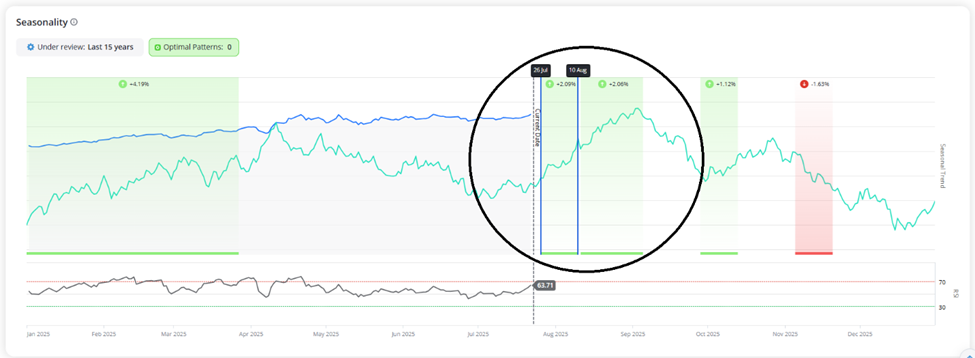
Over the last 15 years, gold prices have risen 80% of the time or more during these windows for an average return of 3.2% across both.
This is just one example of the profit opportunities our Seasonality tool has uncovered.
But there’s one other thing we need if we’re going to buy a gold breakout…
Look for a significant increase in trading volume
Heavy volume reinforces the strength of the move and confirms it’s not a false breakout. Without it, be careful.
Volume plays a huge role in how Luke Lango trades in Breakout Trader. This is a service where he looks to profit from only those stocks in “Stage 2” – an established uptrend (it’s a part of a trading approach called “stage analysis”).
Here’s Luke explaining why volume is so important:
For a Stage-2 breakout, bullish price action is a requirement, but it alone is not sufficient. That rising price needs the support of outsized volume.
Consider the analogy of a sailboat: positioning the rudder and sails is crucial to getting where you want to go, but without wind, the boat won’t go far.
Similarly, a Stage-2 breakout needs heavy buying volume to achieve the momentum required for substantial gains.
A common mistake traders make is overlooking the importance of volume, leading them to buy into a trade that appears to be breaking out on weak volume, only to see it fizzle and reverse.
Bottom line: Gold isn’t giving us a clear “buy” signal yet, but we’re getting close. If we break resistance on heavy volume, it’s go time for a new, bullish trade.
Finally, Eric Fry is saying “Sell Tesla”
Though it’s been a bumpy ride, Tesla has generated enormous wealth for some investors over the last decade.
Today, the company faces a wave of new “bumps” – one of the latest being the end of the federal electric vehicle tax credit.
Last week in the Digest, I noted how CEO Elon Musk spoke to this during Tesla’s earnings call:
I mean, does that mean like we could have a few rough quarters? Yes, we probably could have a few rough quarters.
But our macro investment expert Eric Fry believes the problems for Tesla run far deeper than EV credits:
Tesla is getting crushed around the world by Chinese competitors, like BYD Co. Ltd. (BYDDF), that produce more affordable EVs.
BYD is beating Tesla at its own game. It sold more than 416,000 EVs globally in the first quarter, compared to Tesla’s 336,000 vehicles sold in the same period.
BYD is making more cars and more money – all while selling its vehicles for just over $10,000. That is one-third of what the cheapest Tesla costs.
And Musk can’t depend on Tesla’s Optimus humanoid robots to save his company. Tesla has yet to find formal commitments from large companies wanting to purchase Optimus robots.
[On Friday], The Information reported that Tesla is well behind the pace needed to meet its stated goal of producing at least 5,000 Optimus robots this year. So far, the company has only produced a few hundred.
For these reasons and more, Eric is saying that it’s officially time to get Tesla out of your portfolio.
To replace it, he suggests a direct competitor to Tesla’s Optimus humanoid
This company’s revenue has spiked 15-fold – from just $100 million in 2019 to over $1.5 billion today. And its current backlog means there’s another $23 billion in future sales already baked in the cake.
We’re beginning to run long in today’s issue, so I’ll let you hear it from Eric – for free – in his report right here.
Here’s Eric with more details:
I’ve put all of this company’s information in my new Sell This, Buy That presentation.
What’s more, in this special free broadcast, you’ll also learn how to access my brand-new report, Sell This, Buy That: The $24 Trillion Rise of Robotics.
This report details three more companies set to capitalize on the $24-trillion robotics industry.
Bottom line: If you’re a Tesla owner, be aware of the headwinds gaining strength…and what might be a far better way to invest in robotics/humanoids going forward.
We’ll keep you updated on all these stories here in the Digest.
Have a good evening,
Jeff Remsburg