Oil soars past $100… stocks test support and hold – for now… how stage analysis can help you navigate this market… be careful about buying into the oil trade today… last Friday’s jobs data complicates Fed policy
Editor’s Note: As we’re going to press, headlines report that President Donald Trump has said the war with Iran could be nearing its end.
Trump told a CBS News reporter that “the war is very complete, pretty much.” He went on to say that the U.S. is “very far” ahead of schedule in its stated timeframe for military initiatives.
In response, the major stock indexes are rebounding while oil pulls back.
We’ll address this in tomorrow’s Digest. Below is our analysis of the markets before this last-minute headline. One thing is for sure – expecting and preparing for volatility is more important than ever.
As I write Monday morning, markets are volatile after oil prices spiked over the weekend.
The U.S. benchmark, West Texas Intermediate crude, and the European benchmark, Brent crude, briefly surged to around $115 per barrel Sunday amid fears of escalating conflict in the Middle East and potential disruptions to global supply.
Prices have since pulled back to roughly $96 for WTI and $99 for Brent, but the sudden spike was enough to rattle investors and inject fresh volatility into global markets.
Behind the turbulence is a Middle East conflict that shows no signs of easing. Oil tanker traffic through the vital Strait of Hormuz – a key artery for global energy shipments – has slowed dramatically, threatening to choke off one of the world’s most important oil supply routes.
Let’s jump to legendary investor Louis Navellier with some of the latest developments:
The new leader of Iran, the Ayatollah’s son, apparently, has already been injured already in an airstrike. That comes from an Israeli source.
Meanwhile, Israel hit some oil tanks in Tehran.
That did get people nervous because I am not sure they want the oil infrastructure hurt. But Israel probably had their own reasons for those particular tanker facilities.
Oil prices eased from Sunday’s spike largely on reports that G7 finance ministers were preparing to discuss a coordinated release from strategic petroleum reserves to stabilize markets.
That meeting has now taken place, but no coordinated release was announced (as I write). Even so, crude prices have continued to cool from their weekend highs.
Still, the rollercoaster has Wall Street rattled. Earlier today, all three major U.S. indexes were down more than 1% as oil fears hit the market. Stocks have since stabilized and even attempted a rebound, underscoring just how volatile trading has been.
Though they’ve pulled back from those levels, the broader trend still has them hovering near a critical technical test.
What will happen at the 200-day MA?
At the end of last week, in his Innovation Investor Daily Notes, our hypergrowth expert Luke Lango noted that the major indexes are now trapped between two critical technical levels.
As Luke explained:
The S&P 500, Dow, and Nasdaq are currently stuck between their 100-day and 200-day moving averages.
That’s no-man’s land in technical analysis — a zone famous for chopping up both bulls and bears before the market makes a decisive move in either direction.
Luke wrote that this could work out two ways in the short term:
Markets rarely put in durable bottoms in the middle of that range.
They tend to either reclaim the 100-day on positive momentum, or flush down to test the 200-day and bounce.
Both setups are actionable. Neither has arrived yet.
Since Luke’s analysis, stocks initially moved lower on this morning’s oil fears, pushing the indexes closer to the “flush” scenario he described. As I noted earlier, they’re off their lows, but still approaching the 200-day MA.
So – at least for the moment – markets appear to be testing the downside of that range.
As you can see below, the Nasdaq has fallen below its 50- and 100-day Moving Averages (MAs) in blue and red.
This morning, it hit its 200-day MA in green but has since rallied – and is even trying to turn positive on the day as I write.
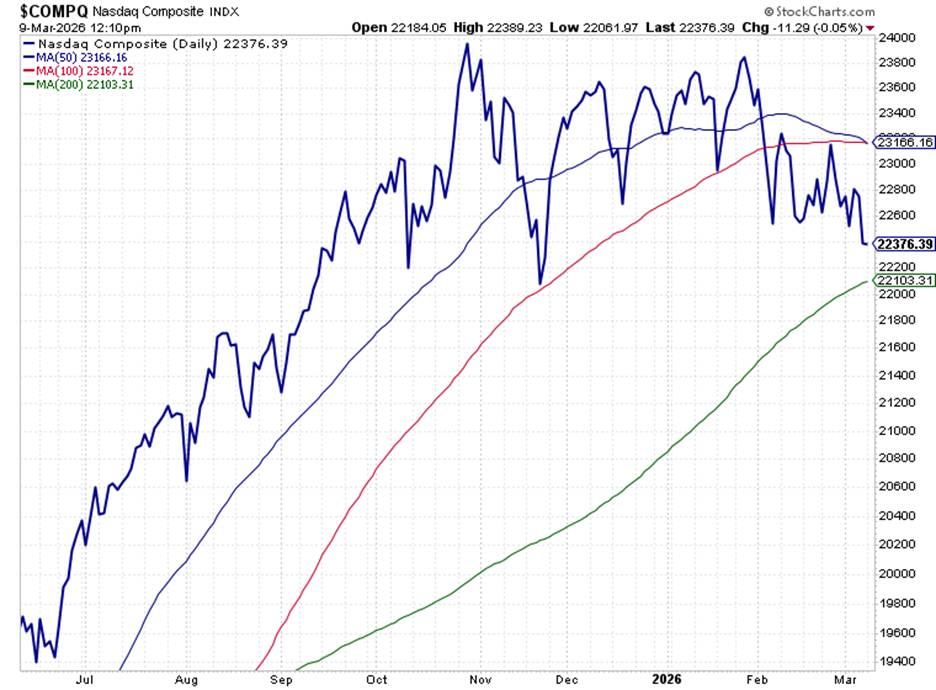
The S&P and the Dow are also approaching their 200-day MAs.
Now, even before this morning’s selloff, Luke was recommending caution. But with the major indexes flirting with this key technical level, he’s also watching closely for a potential tradeable bounce – particularly in AI infrastructure stocks, which he’s been pounding the table on over recent weeks.
Back to Luke:
The trade we want is clear. AI infrastructure names were sold on a thesis that the data is now actively disproving.
Know what you want to own. Know the prices you’d pay. Know what catalyst you’re waiting for — [potentially] a 200-day bounce with a reversal candle.
Be ready to move fast when it arrives.
To be clear, if the indexes don’t find support at their respective 200-day MAs, we’re going lower. So, continue to factor “defense” into your positioning for the moment.
But if we hold and bounce at support, it could be a fantastic entry point for some of the stocks on your watchlist.
This “wait and see” advice echoes Luke’s trading philosophy
There’s a core principle that guides Luke’s approach to short- and medium-term trading…
Price is truth.
In a world where economic data, headlines, and forecasts constantly shift, price action cuts through the noise.
After all, if a stock is rising, that’s what matters for your portfolio – not what an analyst thinks should be happening. And if a stock is falling or simply moving sideways in a choppy range like today, that message matters just as much.
This “let price lead” philosophy sits at the heart of a market framework known as stage analysis.
At its core, stage analysis simply recognizes that every stock tends to move through four phases during its life cycle:
- Stage 1: A bottoming period where prices move sideways
- Stage 2: A breakout phase where the stock begins a sustained advance
- Stage 3: A topping pattern where momentum fades
- Stage 4: A decline as sellers take control
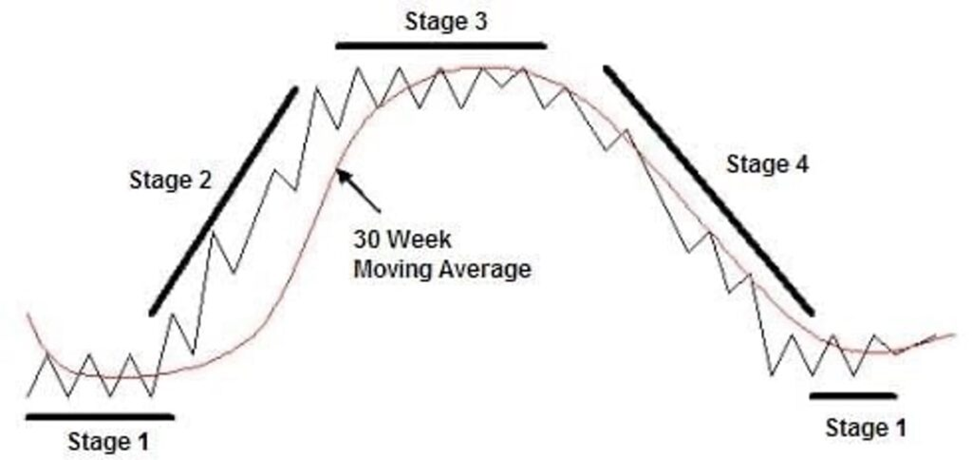
The biggest gains tend to occur during Stage 2, when heavy buying pressure drives a sustained upward move.
But even strong Stage-2 advances rarely move in a straight line. Pullbacks and volatility are normal along the way. What matters is whether the broader trend remains intact. And that’s exactly what Luke is watching right now.
Returning to today’s market setup, if the S&P bounces at its 200-day MA on strong volume and pushes back toward its 100-day MA, that would signal renewed momentum – with many potential trade entry opportunities.
But if not, and we lose the 200-day MA, the S&P would likely fall to the 6,521 – 6,550 zone, which represents the October/November 2025 lows.
With stage analysis, you’re not frontrunning or guessing about what will happen at these levels. You’re simply letting price lead the way.
So, until we see the first signals of which way the S&P wants to break – evidenced through price – stage analysis suggests waiting right now. That’s exactly what Luke is doing.
He’s identifying the companies he wants to own… determining the prices he’s willing to pay… and waiting for the market to confirm that the next trend has begun.
For more on exactly how this process works, Luke recently released a presentation explaining his stage-analysis framework in detail.
In it, he walks through how to identify stocks entering Stage 2… how to avoid those slipping into Stage 4… and even a company currently sitting closest to potential breakout territory.
Returning to the oil and gas sector
One week ago today, we put the United States Oil Fund (USO) on your radar as a way to play the spike in oil prices.
If you bought in, congratulations, you’re up 23%.
But be careful about buying today.
For more on this, let’s go to Brian Hunt, editor of Money & Megatrends:
After sprinting flat out for more than a month, the oil sector is due for well-deserved rest.
Behind Brian’s call is simple mean reversion.
This is the idea that after a financial instrument has experienced a large move in one direction and is in an abnormal state, it is likely to “revert” to a more normal state.
Brian likens stocks to runners, noting “they can’t sprint flat out for miles at a time. They need to take breaks… or ‘breathers’.”
But Brian’s call isn’t just about mean reversion. He highlights a political angle:
The White House is fully aware that Operation Epic Fury could have painful “bad domino effects.”
Epic Fury is raising oil prices… which could raise American gasoline prices… which could hurt the Republican party during the mid-term election season.
There is enormous incentive for Trump to end this quickly and let the markets calm down.
Now, Brian is quick to say that anything is possible with Trump. But still, if you’re sitting on a huge pile of overnight cash from this trade, taking a few dollars off the table isn’t a bad idea.
Back to Brian:
The odds favor a big correction in oil and oil stocks soon.
One more thing investors are watching – the labor market
Finally, don’t forget the other macro development investors began digesting late last week.
On Friday, the Labor Department reported that the U.S. economy lost 92,000 jobs in February, a headline that initially rattled markets.
Now, the report wasn’t quite as bad as it looked. A large healthcare strike and severe winter weather both distorted the data, temporarily dragging down payrolls.
Even so, the numbers reinforced a broader trend: the labor market appears to be gradually cooling. And this raises an important question we’ll tackle in a coming Digest.
With oil prices spiking while the labor market slows, the Federal Reserve finds itself in a difficult position. Rising energy prices tend to push inflation higher, but a cooling job market could argue for lower interest rates.
That’s a difficult combination for policymakers…
The Fed typically raises interest rates to combat inflation but cuts rates to support a weakening labor market. However, oil-driven inflation and slowing job growth would pull those tools in opposite directions.
So, what will the Fed do?
We’ll dig into this soon.
Coming full circle
Investors are dealing with several crosscurrents right now.
Oil prices have surged on geopolitical fears… major indexes are testing key technical support levels… and the broader economic picture remains uncertain as the labor market cools and policymakers weigh their next move.
This uncertainty can feel uncomfortable for investors, but it’s also part of how markets transition from one trend to another.
For now, the smartest approach may be the same one Luke is following: let price reveal the market’s next move – but be ready to act once it does.
We’ll keep you updated here in the Digest.
Have a good evening,
Jeff Remsburg