

Want to know why the stock market struggled in February after soaring in January? Because everyone has suddenly become worried about “re-inflation” and rising interest rates over the past few weeks. But our analysis suggests such fears are entirely overblown, and that recent market weakness is a golden buying opportunity.
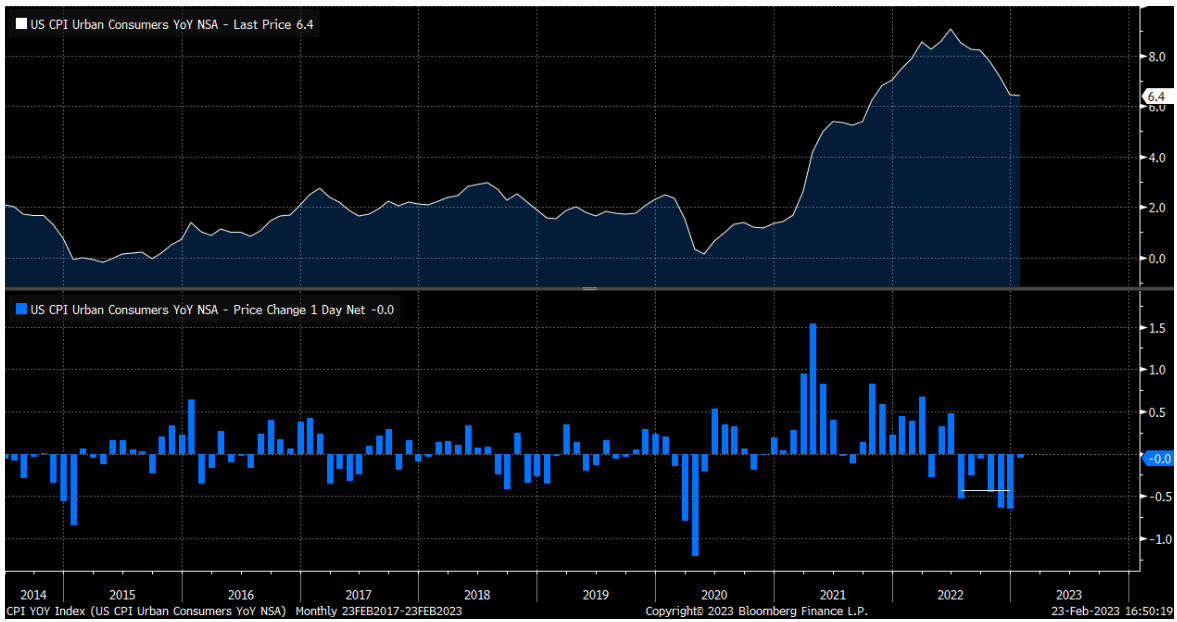
Runaway inflation was the main reason stocks got crushed in 2022. But inflation peaked in June and, ever since, has been dropping by about 40 basis points per month. As inflation has dropped, stocks have risen. From June to January, the S&P 500 rose about 8%.
Last month, though, inflation barely declined. The headline inflation rate – as measured by the CPI – fell less than 10 basis points month-over-month. The massive slowdown in the pace of disinflation freaked everyone out. Suddenly, there are a lot of folks out there calling for inflation to “heat back up” over the next few months. Those re-inflation fears have dragged on stocks, leading to an increase in the 10- and two-year Treasury yields, which move on expectations from the Federal Reserve.
History, however, strongly suggests that inflation won’t “heat back up” anytime soon.
The Truth About Disinflation
The thing about disinflation cycles is that they are secular – not cyclical. That is, disinflation cycles are never short or small. They are always long and big.
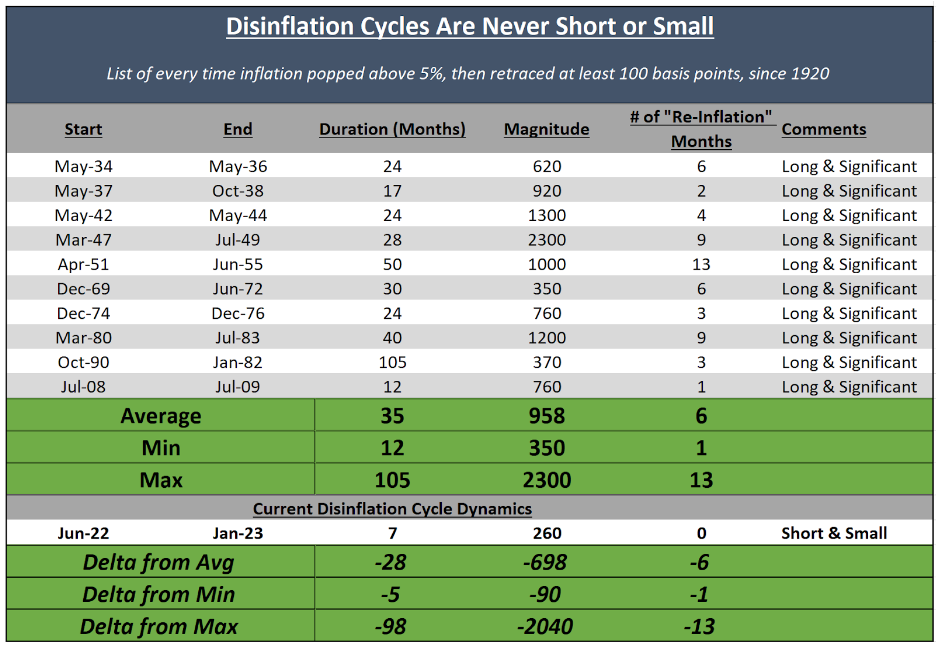
Since 1920, the U.S. economy has undergone 10 different major disinflation cycles wherein inflation topped 5%, then reversed course. (That is exactly the situation we have today.)
Each time, the disinflation cycle lasted at least 12 months and shaved at least 350 basis points off the headline inflation rate. On average, these 10 disinflation cycles lasted over two years and shaved around 950 basis points off of the headline inflation rate.
Point being: Disinflation cycles are always long and big.
The current disinflation cycle, however, is not yet either long or big. It is short and small.
The current disinflation cycle has lasted for just seven months so far, with just 260 basis points of disinflation.
If this cycle were to end now or anytime soon, that would be unprecedented
.
Instead, the historical precedent here is for the current disinflation cycle to continue for at least another six months (and likely another 12-plus months). During that time, inflation should drop at least another 100 basis points (and likely another 300 to 400-plus basis points).
Also of note: Disinflation cycles are never smooth. In every major disinflation cycle of the past 100 years, there was at least one CPI report wherein the headline inflation rate reaccelerated in a month. Oftentimes, there were multiple such “re-inflation” reports.
Never, though, did those one-off re-inflation reports end the disinflation cycle.
Said differently, one-off “hot” CPI reports are a natural part of the disinflation cycle. There is nothing unusual about the “hot” CPI report we got a few weeks back. History says that’s par for the course.
The Final Word
And of course, the most important part here – stocks tend to surge during these disinflation cycles.
In eight of the 10 major disinflationary cycles of the past 100 years, stocks rose during the cycle. Average returns were over 30%.
The only two times stocks didn’t rise during a disinflation cycle were when the cycle coincided with two of the worst recessions in U.S. history: the 2008 financial crisis and the Recession of 1937 (in which GDP dropped more than 18%).
In other words, history is telling us two very profound things right now:
- The disinflation cycle that we’re currently in will last for a lot longer, and inflation will fall a lot farther.
- Barring a deep recession, stocks will soar over the next 12 months.
At this point in time, a deep recession looks very unlikely. As such, a massive stock market rally over the next 12 months looks very likely.
Are you positioned to capitalize on this rally?
On the date of publication, Luke Lango did not have (either directly or indirectly) any positions in the securities mentioned in this article.