

Turn on the TV or scroll on social media, and you’ll find every self-proclaimed market sage, financial influencer, and Wall Street whisperer shouting their take on stocks into the void.
The ‘experts’ have emerged from their bunkers. But it seems none of them can agree on what’s to come.
Some say to buy the dip. Others advise to stay far away. And many still warn: This is 2008 all over again.
So… which is it? Historic buying opportunity, or just the first leg of a much larger collapse?
We’ll venture to answer that – not with opinion and theory but with data.
And to us, the data is screaming one thing: If you’ve got time on your side, you should be buying stocks hand over fist right now.
Though, of course, we’ll let you decide for yourself.
Here’s what we’re seeing…
A Fast-and-Furious Decline in Stocks
This recent market madness began when President Trump’s “Liberation Day” tariffs were announced on Wednesday, April 2. Investors didn’t take the plan lightly.
That Thursday, April 3, the S&P 500 dropped more than 5%. Then on Friday, it slid another 5%-plus.
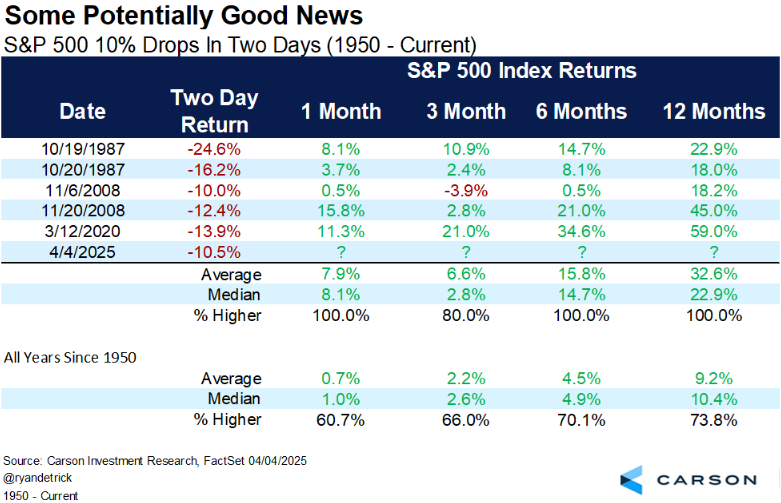
That’s a 10% two-day crash – a move that’s not just rare but nearly unprecedented.
Since 1950, this kind of price action has occurred just five times:
- Twice during Black Monday (1987)
- Twice during the great financial crisis (2008–09)
- Once during March 2020’s COVID Crash
Now, here’s the important part: All five times, the S&P was higher one year later. The average 12-month return? 33%. Even with the worst-case outcome, stocks were up 18% by that time the next year.
But, of course, the selling didn’t stop in the two days after the “Liberation Day” tariffs were announced.
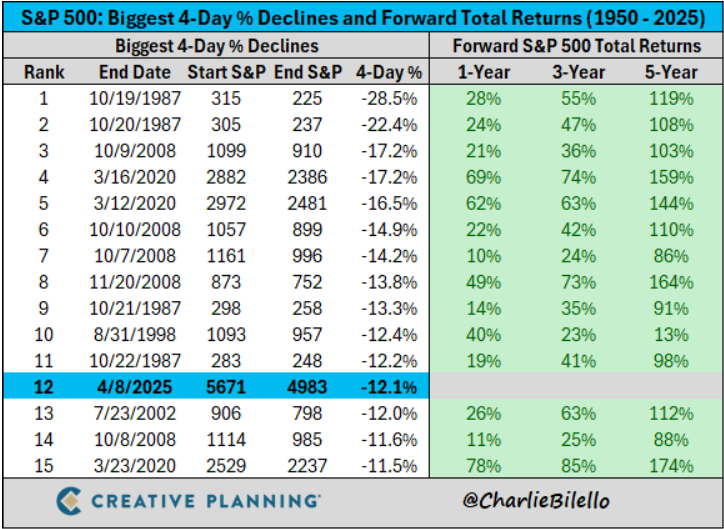
This past Monday added more pain. The three-day total decline reached 11%, marking the 11th-largest three-day drop since 1950.
On Tuesday, April 8, we slid even further, bringing the four-day collapse to 12.1% – the 12th-worst four-day stretch in modern market history.
And guess what?
Every other time the market has fallen more than 10% in three days or more than 12% in four days, it was higher a year later.
And sometimes, stocks moved way higher. After similar four-day collapses, the market’s average return over the next 12 months is nearly 70%.
Then came the snapback rally.
Bullish Historical Signals
On Wednesday, April 9, President Trump announced a 90-day pause on all country-specific reciprocal tariffs (except China). It was the first signal that the administration might pivot from trade war escalation to negotiation.
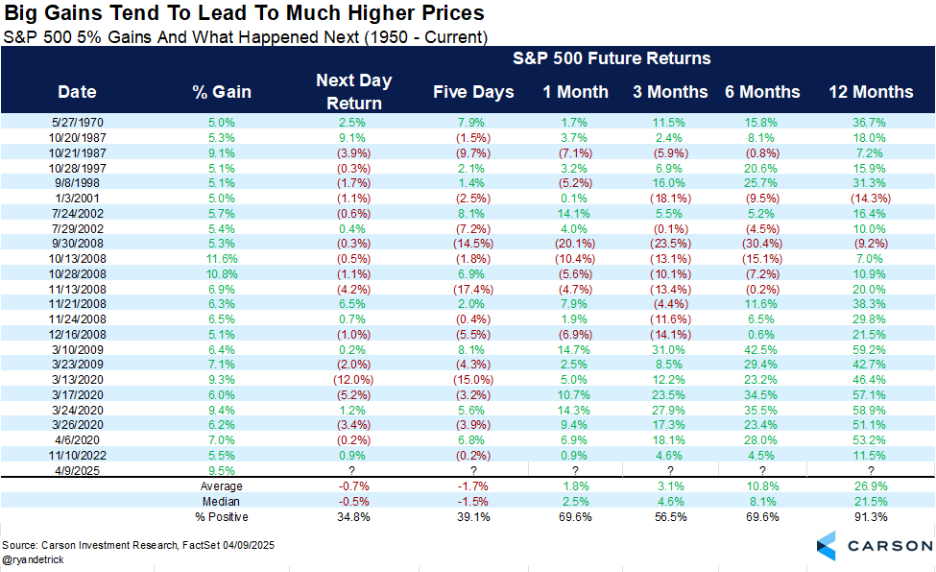
And the market’s response was explosive. The S&P 500 surged 9.5%, marking one of the biggest one-day gains of all time.
Since 1950, the S&P has only rallied more than 5% in a single day 23 times. In 21 of those instances (91% of the time), the market was higher a year later, with an average return of 27%.
So far, that fits the pattern: Big selloff. Big rally. Big opportunity.
Now, we’ll admit; Thursday was rough. Stocks gave up a large portion of the 9%-plus gains they notched on Wednesday.
Indeed, the S&P dropped 3.5%, leading some to cry “dead cat bounce.”
But historically? Even that’s bullish.
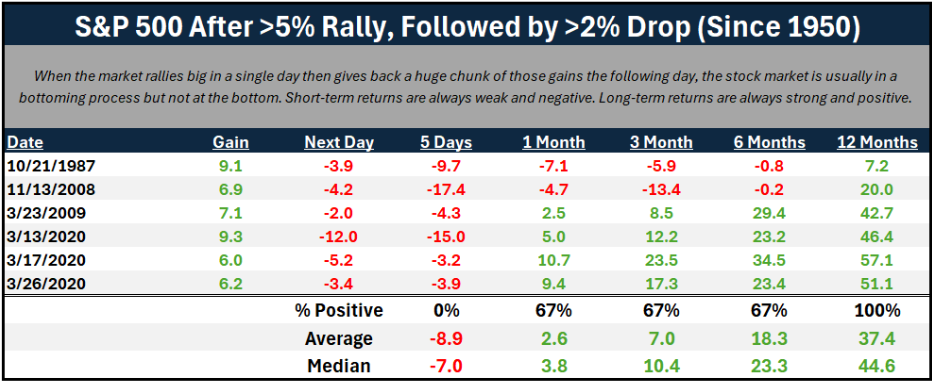
Since 1950, every single time the S&P 500 rallied more than 5% in one day, and then dropped more than 2% the next day, the market was higher a year later, with average 12-month gains north of 37%.
In other words, even the rejection of a bounce has been a bullish historical signal.
Does the Data Say to Buy Stocks Now?
And then there’s the widespread fear.
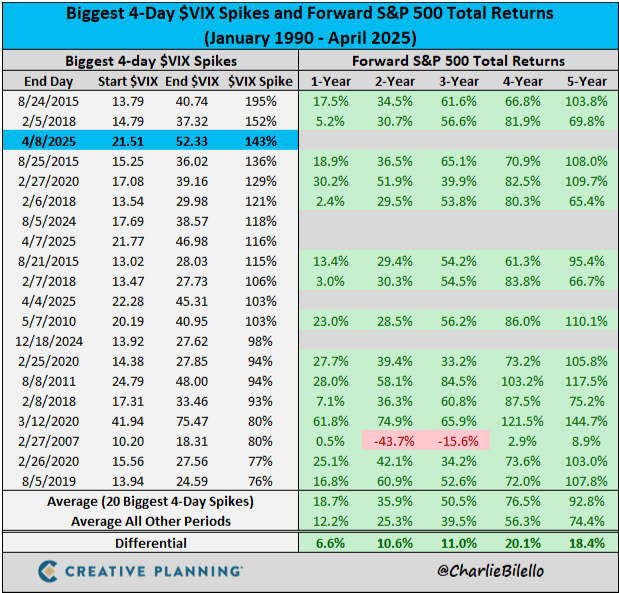
The volatility index (VIX) – Wall Street’s fear gauge – has spiked more than 100% in just a few days. It’s now hovering around levels we’ve only seen during the 2008 financial crisis and the COVID crash.
And what did markets do after the VIX last touched these levels?
They ripped higher.
After the VIX hit 50-plus in 2008, stocks rallied more than 60% in 12 months.
And after the VIX spiked during COVID, stocks exploded 70%-plus in a year.
Fear of this magnitude doesn’t last. But it does create opportunity – for those brave enough to act.
We’ve likely all heard Warren Buffett’s famous adage: “Be fearful when others are greedy, and greedy when others are fearful.”
But how many investors actually live by it?
Because the truth is that this is what fear – what blood in the streets – looks like:
- Double-digit percentage drops in a matter of days
- Terrifying headlines about trade wars and GDP crashes
- Talking heads calling for the next Great Depression
This is what most folks run away from. But history shows it’s exactly what you should be buying into.
The Final Word on This Buying Opportunity
Now, we want to be clear. We are not saying this is the bottom. In fact, we don’t think it is.
The volatility is still high. The situation with China is still unresolved. More short-term pain could absolutely be on the way.
But here’s the thing: You don’t need to buy the exact bottom – just bottom enough.
And based on the price data, volatility signals, and fear levels, it’s hard to argue we’re not in that zone already.
If you’ve got a six- to 12-month time horizon, the odds are stacked in your favor.
Every historical signal we track suggests that this is a generational buying opportunity for patient investors.
So, you may not feel good buying today. But you’ll probably feel great looking back on it a year from now.
Let’s stay smart, patient, and long-term focused to make the most of this moment.
And when it is time to buy the dip, AI 2.0 stocks may be the best bet.
We’re talking AI that can respond to real-world environments; embodied intelligence that can see, hear, walk, talk, lift, carry, organize, fix, learn…
Indeed, there’s a reason why every tech titan is suddenly obsessed with humanoid robots.
That’s where we believe the next trillion-dollar investment opportunities will be found. And we’ve found a compelling way to play that next phase of the AI Boom.
Uncover the details on our favorite AI 2.0 pick.
On the date of publication, Luke Lango did not have (either directly or indirectly) any positions in the securities mentioned in this article.
Questions or comments about this issue? Drop us a line at langofeedback@investorplace.com.