

Tom Yeung here with today’s Smart Money.
The federal government shut down at midnight last night after the Senate failed to pass a short-term funding bill.
I know it’s worrying to see the doors of Congress locked… not to mention the concerns about travel delays or trouble signing up for government benefits.
But markets have historically ignored past government shutdowns.
According to Bank of America, the six shutdowns since 1990 have caused the S&P 500 to rise 1% – a rounding error in the grand scheme of returns. The most recent shutdown in 2018 saw markets jump 5%.
That’s because government shutdowns generally have little impact in the long run. Government workers are still paid retroactively by law (even though they cannot come into work) and many essential services from Social Security to Medicare will continue running.
Congress estimates that the 35-day shutdown in 2018-’19 shaved just 0.2% off GDP, which was mostly made up in subsequent quarters.
Of course, this time could be different. Last week, the White House instructed federal agencies to prepare for mass layoffs in a government shutdown. There’s also less political appetite this time to make a deal.
That’s one reason for gold prices recently hitting fresh all-time highs. On September 22, gold hit a record $3,728 per ounce, only to break that record a week later after surging past $3,800. They now sit at $3,900 today.
So, today I’d like to look at the question… what happens to gold prices when gold itself reaches a new record?
And then I’ll share why now is a great opportunity to buy gold hedges.
Let’s take a look…
The Ultimate Safe Haven
In a recent Smart Money, I explained how new S&P 500 record highs typically lead to further gains.
Since the end of 1927, each new stock market peak has been followed by a roughly 9.9% return the next year (Stage 1). After that, prices “flatline” for a while (Stage 2) before returning to trend growth (Stage 3).
That means the S&P 500’s current Stage 1 cycle, which began in January 2025, has at least another five to six months of historically fast growth before it reaches the Stage 2 “flatline,” roughly 300 trading days after a new record is hit. We recommend staying invested in stocks as a result.
This leads me back to gold.
In the graph below, I noted every new gold record since January 1980 as “Day 0” and calculated returns from those dates. To prevent double-counting, I ignored every record high within 12 months of another one.
In other words, if gold reaches a new record two days in a row, only the first day is counted.
Here’s the gilded story we get…
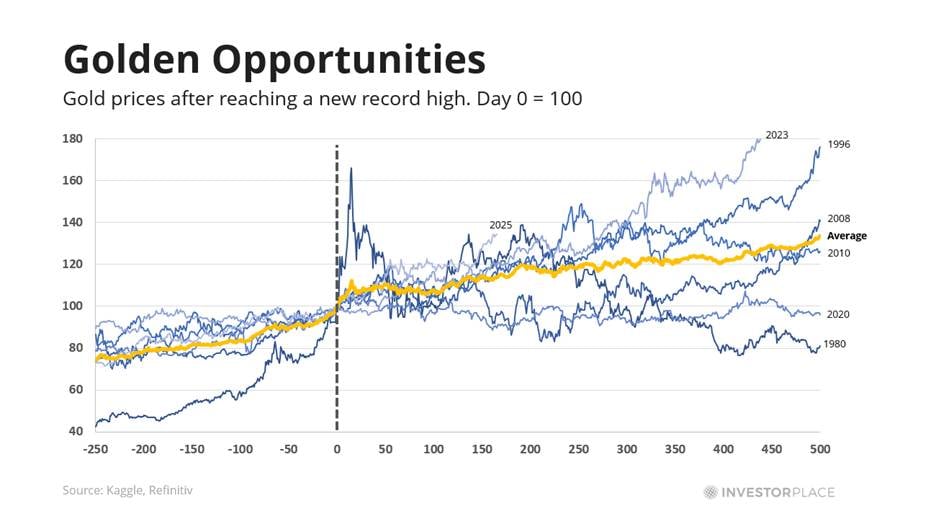
Of the seven times gold has hit a new record since 1980, prices continue to march higher over the following two years.
On average, they have returned 19% the first year (2X more than the S&P 500 when it hits a new record) and then 12.2% the next.
There is no surge or flatlining. It just keeps going up.
That’s a relatively bullish signal for gold’s current bull market, which began in January 2025. Prices have surged 34% since the precious metal hit a new record high that month, and if history is any guide, gold prices should keep rising for at least another several quarters.
Now, it’s essential to note that seven data samples don’t always mean a trend.
Much like flipping “heads” seven times in a row or hitting every green light on the way to work, low-probability outcomes can happen with small sample sizes.
In addition, gold’s surge since its latest January record high means prices have already overshot their long-term average by 21%. By that measure, we could be due for a correction. We saw a little bit of that on Tuesday when prices slipped a percent on profit-taking.
However, more extensive studies have indeed shown that rising gold prices usually signal more gains ahead. This “momentum” effect has been demonstrated across numerous time periods using a variety of methods.
And there are many possible reasons for momentum to exist in gold…
Now Is the Time to Hedge
Some researchers at the Chicago Federal Reserve Bank, among others, believe government interest rates are the key driver. Others speculate that individual investors are the cause.
Additionally, uncertainty surrounding U.S. government policy has pushed institutional investors into physical gold and gold-backed exchange-traded funds (ETFs). Gold-buying by central banks is expected to hit 900 tons this year, twice the 2016-2021 average, while gold ETFs have seen their largest first-half inflows this year since 2020.
What’s more, foreign governments are looking to diversify from America’s constant stream of self-inflicted crises. The Chinese central bank recently notched its ninth consecutive month of gold buying, and Indian gold imports nearly doubled in September.
International traders know that even if America passes this October budget, we’re only seven weeks away from the next showdown on November 21.
And so, we believe that any profit-taking in the coming weeks is a great opportunity to buy gold hedges.
In risky times like these, it’s better to have a little bit saved in gold than none at all.
In fact, all three major indices were down this morning following the government’s midnight shutdown – but Eric’s play on gold is up.
To learn how to access Eric’s recommendation on gold, click here.
Until next week,
Tom Yeung
Market Analyst, InvestorPlace
P.S. Last week, we shared two essays on TradeSmith’s powerful new trading tool – the “T-Line.” You can read those here and here.
TradeSmith’s team of data scientists, quants, and coders has created this tool to spot mispricings in the market, giving everyday investors a hedge fund-level edge.
And TradeSmith’s Keith Kaplan just revealed how the tool works in yesterday’s T-Day Summit.
To find out more about cutting your risk while boosting potential returns, backed up by real-world examples, watch the replay of the event here.