
History doesn’t repeat itself, but it sure does rhyme.
That nugget of wisdom is attributed to Mark Twain, the famed American author and humorist who had pretty keen insight on what makes us tick.
This rhyming of history is evident in the stock market as well. Nearly every major event, big move, or trend has some type of historical antecedent that can help us think about what’s to come.
One of those historical patterns is especially relevant now that the midterm election is behind us. It’s part of the presidential cycle in the market.
It’s actually the good part. The cycle is pretty reliable, and it looks as if it may be about to rhyme once again, independent of the results that continue to come in.
And if it really is rhyme time, investors have reason to be pretty excited…
One Day to $2,475?
One of our InvestorPlace analysts has shown readers how they can receive an instant cash payout of as much as $2,475 – in a single day.
Even when the market crashed and recovered last year, you could have collected payouts like $1,655… $1,480… and $1,375… every day the market was open.
The Best Year of the Cycle Is Dead Ahead
The presidential cycle was first articulated by Yale Hirsch, who created the Stock Trader’s Almanac more than half a century ago.
Broadly speaking, the theory goes that presidents spend the first two years of their term trying to fulfill campaign promises, and they spend the last two years trying to strengthen the economy in the hopes of getting reelected.
With the midterm election now complete, we are entering the back half of the cycle – and more specifically, we are entering the third year, which is far and away the strongest. You can see it in this table LPL Research published two years ago…
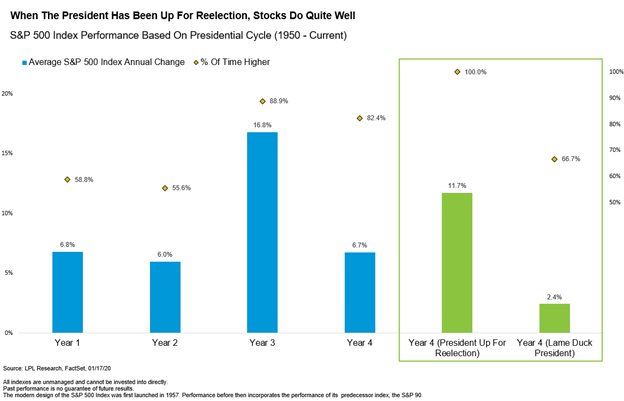
Returns in the third year of the presidential cycle are at least 2.5X greater than each of the other three years.
By that measure, now is not the time to be on the sidelines. Note, too, that the second year is historically the weakest. That seems likely to be true again in this cycle.
This is not just a short rhyming limerick; this is more of an epic poem. The Dow Jones Industrial Average has consistently risen up to and after midterm elections for much of the past 90 years.
Getting through the election isn’t just nice because we don’t have to see the same commercials over and over again, but also because the market usually strengthens considerably in the year ahead.
Two Key Factors Point to Positivity
But… we’d be crazy to ignore the dark clouds that have made 2022 a down year for most of us.
However, if you’re a part of our research service, Strategic Trader, your story has been a little different…
- In total, we’ve closed out 116 trades this year, and 109 have been winners.
- Of those 100 winners, the average win has been 2.40%.
- And our average annualized return for all closed positions is a whopping 228.97%.
(You can learn how to join Strategic Trader here.)
While things may look bleak and bearish on the surface, positive changes are happening in the market. We’re starting to build a base of stability.
First, traders are starting to relax. They are not as worried that the market is going to suffer a huge, unexpected shock.
You can see this playing out in the CBOE S&P 500 Volatility Index (VIX).
The VIX – also called the “Fear Index” – essentially measures how fearful investors are about the state of the market. The higher the VIX’s number, the more fearful investors are – and vice versa if the VIX’s number is lower.
But as you can see below, the VIX is dropping down to the bottom of the range it has been bouncing back and forth in all year.
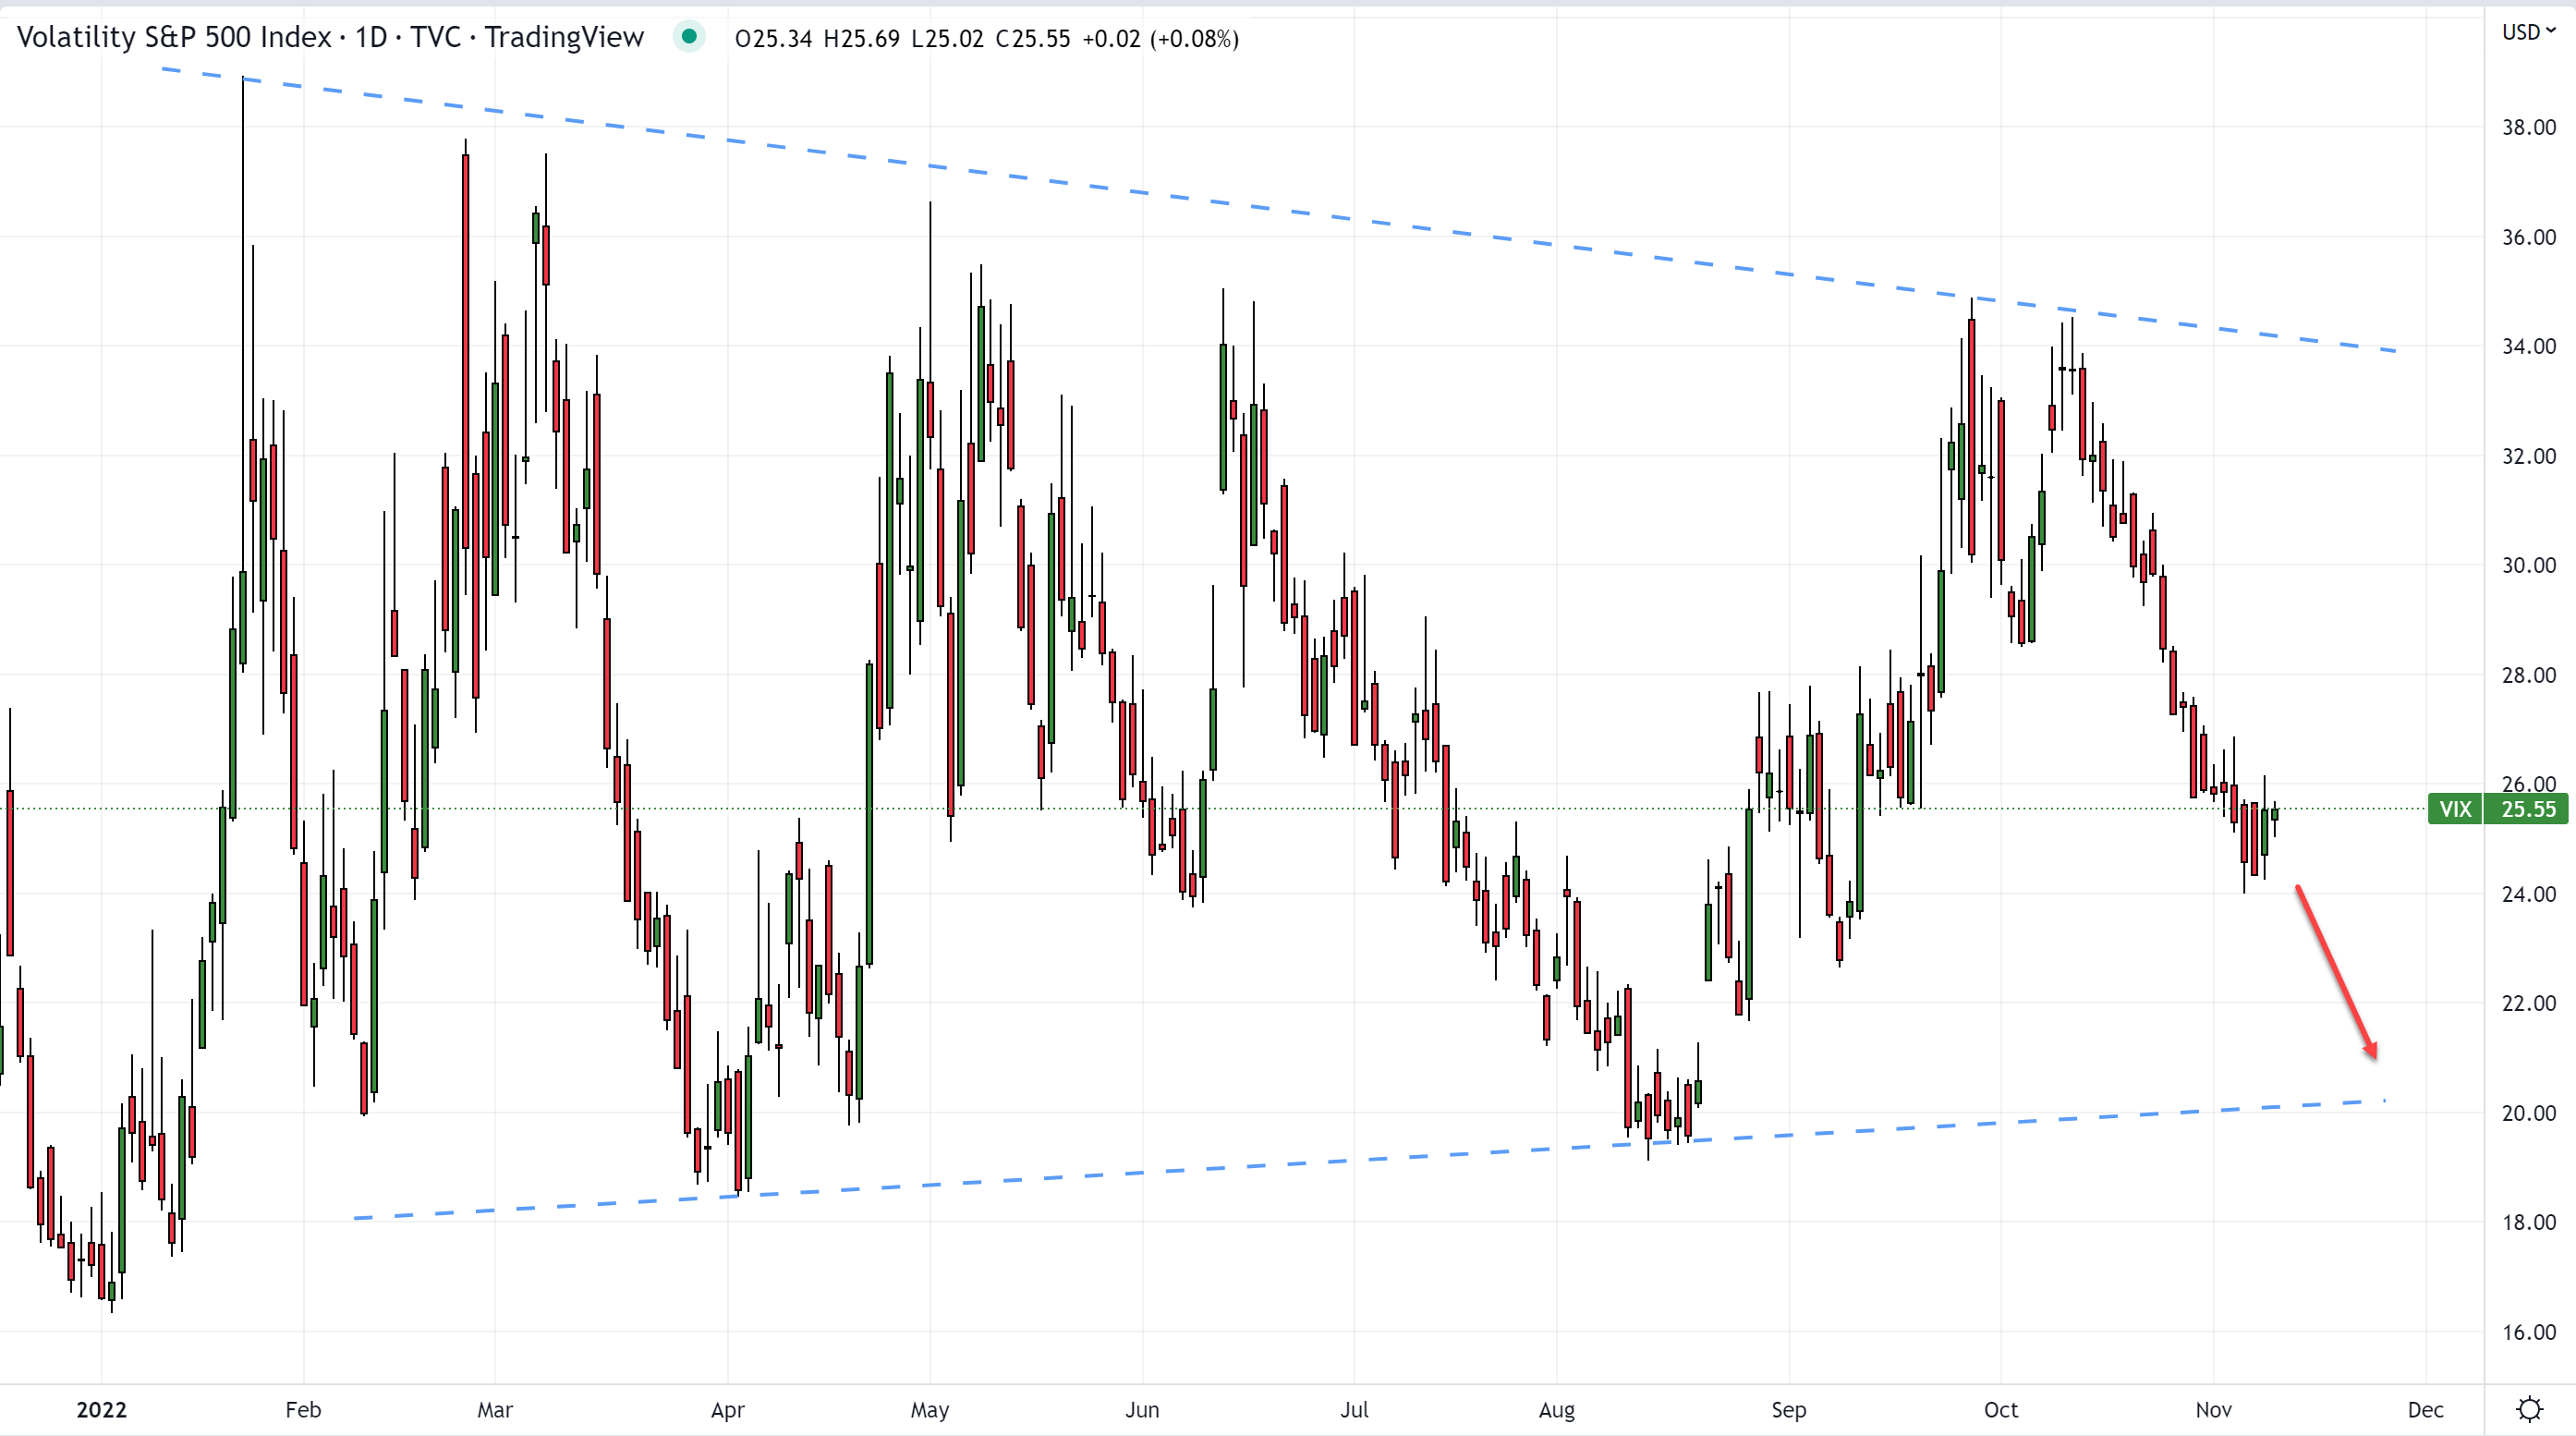
This tells us that traders aren’t as fearful, which is indeed promising.
Second, the percentage of S&P 500 components that are trading above their 200-day simple moving average (SMA) is rising.
When a stock is trading above its 200-day SMA, it shows the stock is relatively strong – and vice versa.
Looking at the daily chart of the S&P 500 Stocks Above 200-Day Average (S5TH) below, you can see that 40.23% are currently trading above their 200-day SMA. This is way up from the low of 10.53% in late September.
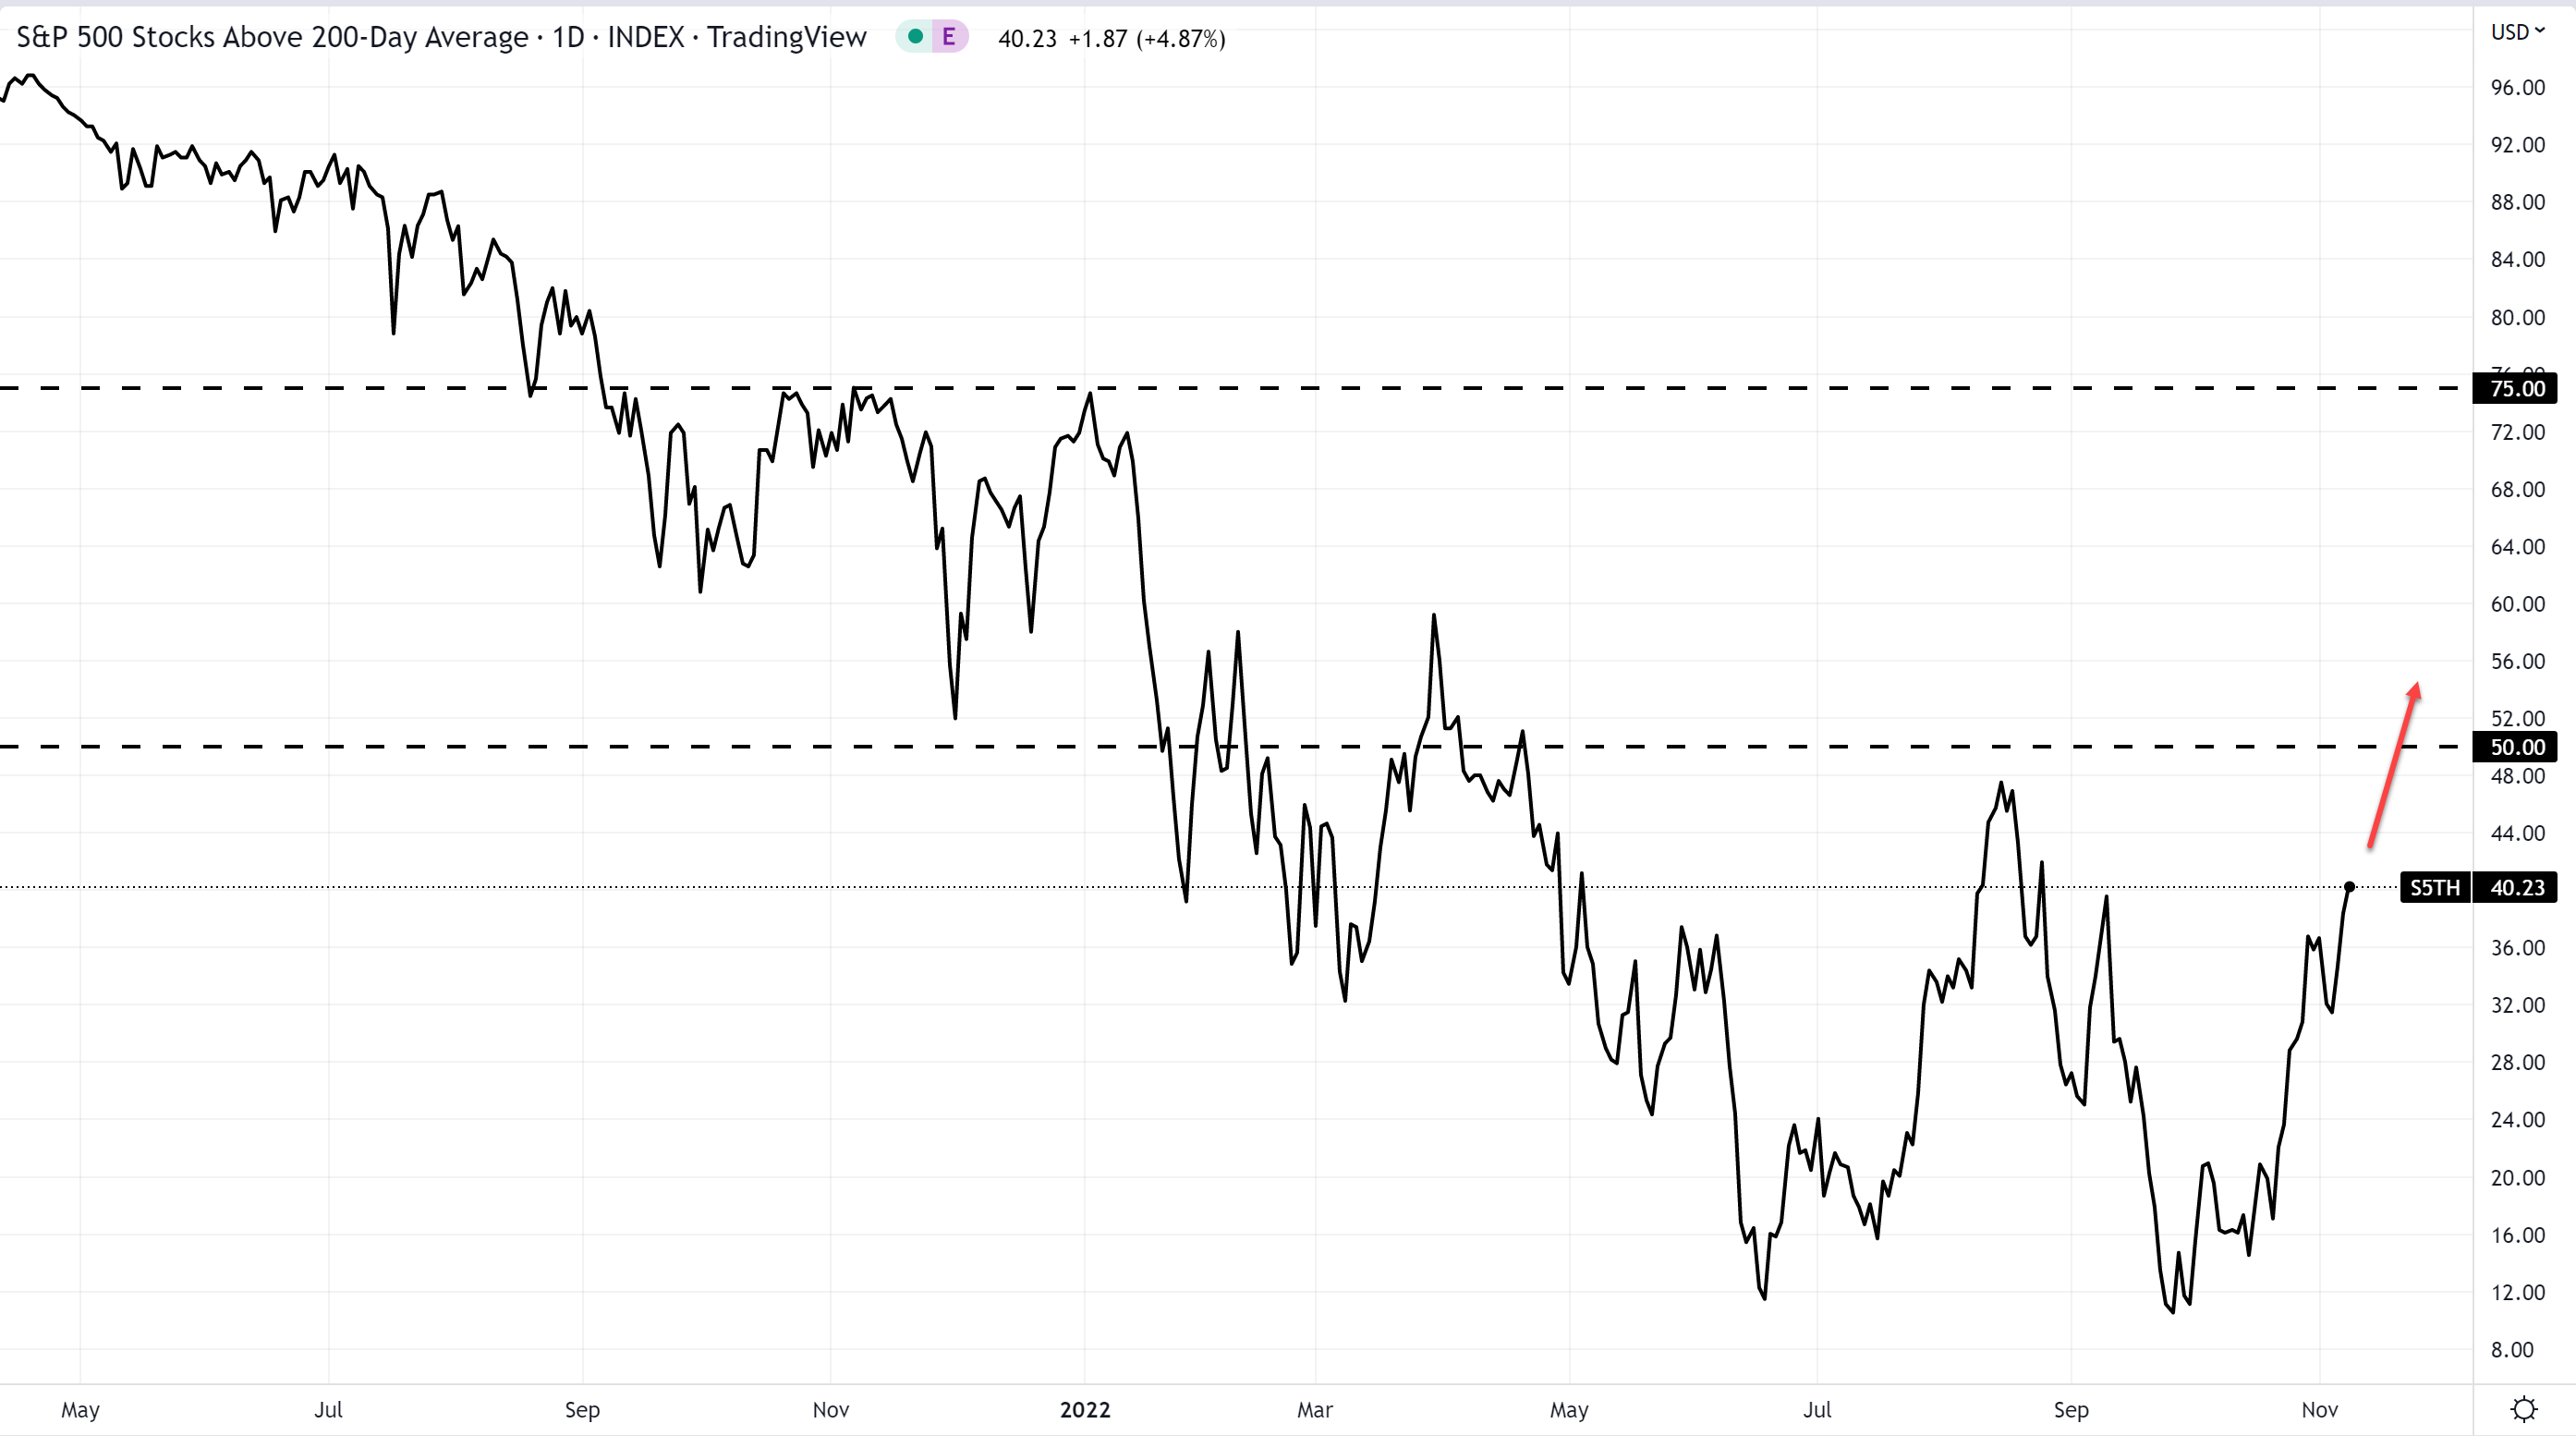
If this number can climb above 50% in the next month or two, we should see some sustained bullish momentum.
The primary reason we haven’t seen this bullish momentum in the base showing up in the headline number of the S&P 500 is this movement hasn’t been happening in the mega-cap stocks, and the S&P 500 is a market cap-weighted index.
The easiest way to visualize this is by looking at a heatmap of the performance of the components of the S&P 500.
The heatmap from finviz below shows the performance of each component in the S&P 500 over the past week – the brighter green the block, the better the company has done, and the brighter red the block, the worse the company has done.
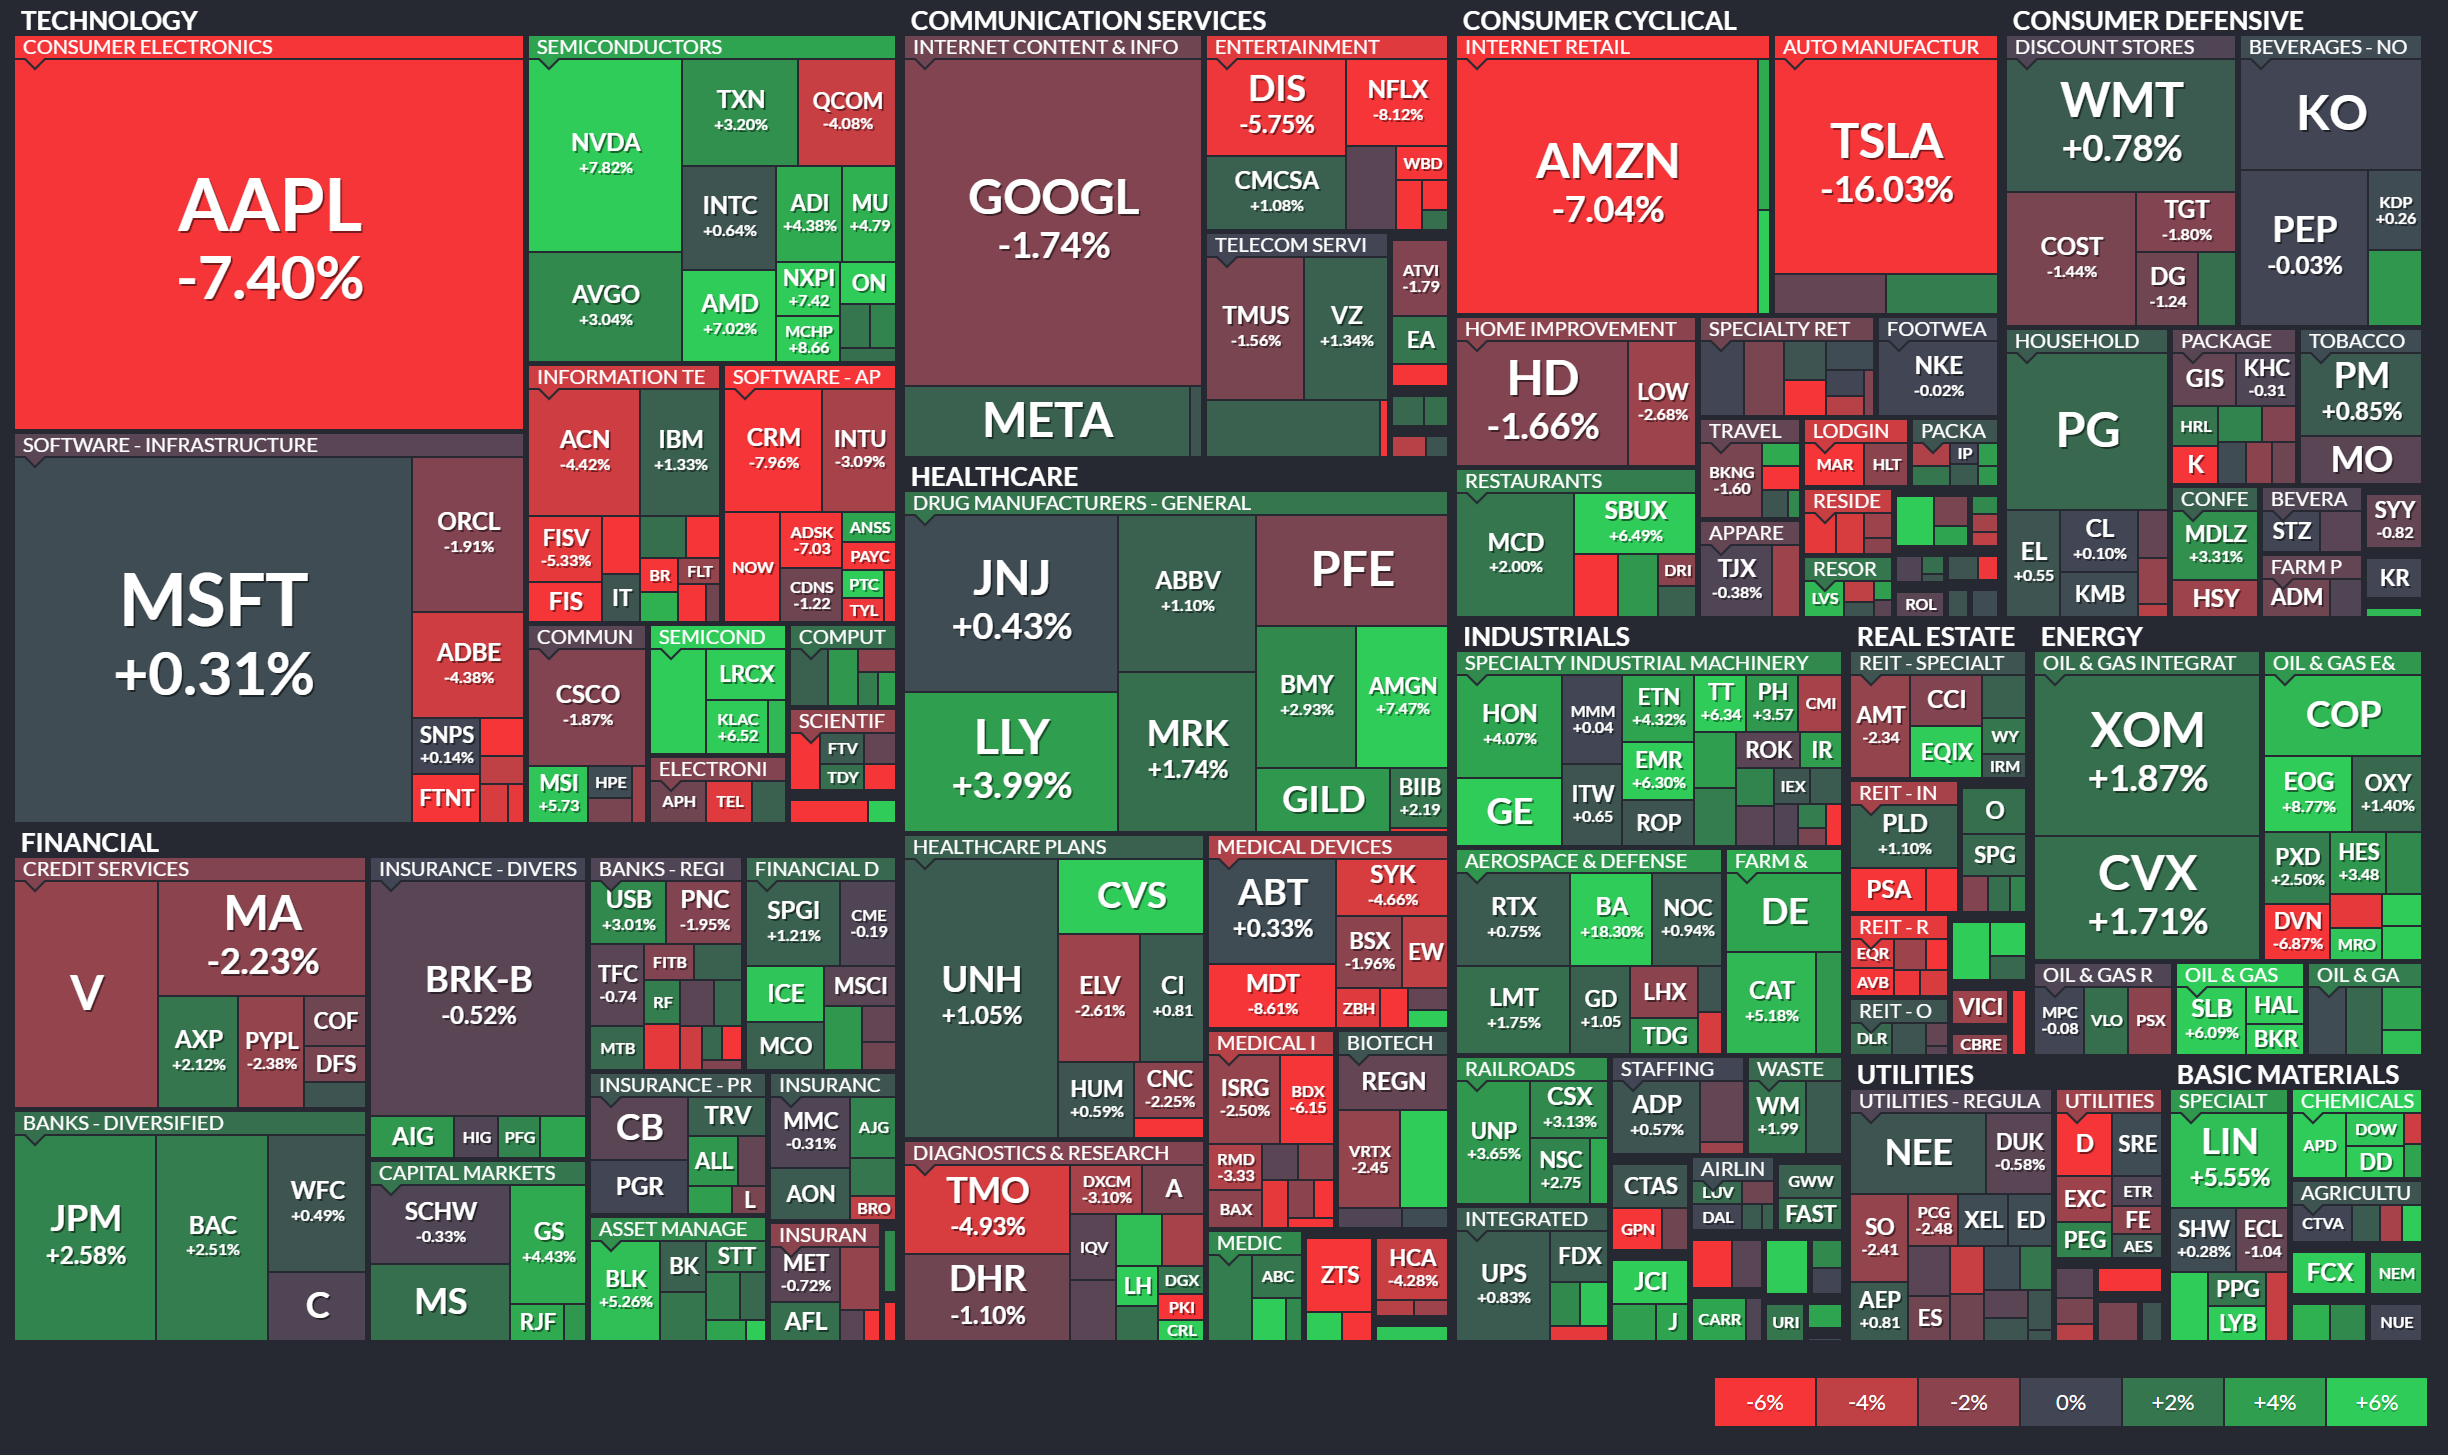
As you can see, there is a lot of green on this heatmap.
However, the mega-cap companies – which are indicated with larger blocks in the heatmap – have been posting terrible performance. If it weren’t for the huge losses Apple Inc. (AAPL), Amazon.com Inc. (AMZN), and Tesla Inc. (TSLA) are incurring, the S&P 500 would probably already be back in bull-market territory.
The Bottom Line
We expect the losses on the mega-cap stocks in the S&P 500 to slow down soon. In fact, they may even start to rebound.
This turnaround, coupled with continued strength in the smaller companies in the index, should provide the momentum the S&P 500 needs to break back into bull-market territory in the coming weeks.
To close with a final word from Mark Twain…
It is not worthwhile to try to keep history from repeating itself, for man’s character will always make the preventing of the repetitions impossible.
Regards,
John and Wade