Etsy Inc (NASDAQ:ETSY) operates a niche business that lacks the market breadth, scale and resources to effectively compete against well-established e-commerce giants. The future profit expectations embedded in the stock price exceed what the company can reasonably be expected to achieve. Further, the company’s enterprise value exceeds what a potential buyer could reasonably be expected to pay for the business. Each of these factors create an unbalanced risk/reward trade-off that is not in investors’ favor. Etsy, Inc. (ETSY, $16/share) is this week’s Danger Zone pick.
ETSY Background
Etsy Inc. (ETSY), a global e-commerce platform for handmade artisan goods, was 2015’s worst performing IPO. ETSY priced at $16/share, quickly rose to $31/share, and then dropped sharply to end the year at $8/share. The stock has traded like a “tech start-up” at some points and a “retailer” at others. ETSY has also received a reputation as a playground for profligate Brooklyn bohemians not focused on creating shareholder value.
In May 2017, ETSY changed CEOs and took a hatchet to the workforce. The changes sparked investor optimism that ETSY can boost profitability by reining in expenses without negatively impacting already slowing revenue growth. ETSY has also drawn activist investors, at least one of which intends to push for a sale of the company. Due to these events, rather than fundamentals, ETSY is once again trading near its IPO price.
Growth is Clearly Slowing
ETSY’s revenue has grown 39% compounded annually since 2013 and grew 33% in 2016. In February 2017, the company guided to 20-22% revenue growth and 15-17% gross merchandise sales (GMS) growth in 2017. In early August, guidance was lowered to 18-20% revenue growth and 12-14% GMS growth.
Per Figure 1, revenue grew 19% and GMS grew 12% in 2Q17 vs. 2Q16. 2Q17 growth was roughly half as strong as the growth experienced in 2Q16, when revenue grew 39% and GMS grew 23% compared to 2Q15. Notably, 2Q16 growth reflected a minimal slowdown compared to the 44% revenue growth and 25% GMS growth experienced in 2Q15 vs. 2Q14.
Figure 1: ETSY’s Growth in Revenue, Merchandise Sales and Active Sellers

Sources: New Constructs, LLC and company filings
Profits Have Been Meager to Date
ETSY generated a cumulative $5 million of after-tax profits (NOPAT) from 2013-2015 while earning an average NOPAT margin of 1%. ETSY experienced its most profitable year in 2016 with NOPAT of $19 million. This profit increase was driven by an improvement in NOPAT margin to 5% in 2016 from 1% in 2015.
More recently, this progress has been reversed due to increased competition and lack of expense discipline. Expense growth began accelerating in 2H16, just as the revenue growth slowdown took hold. This expense growth drove a decline in NOPAT margin to -1% and a $4 million operating loss over the trailing twelve months (TTM), per Figure 2.
Figure 2: NOPAT and Economic Profits vs. GAAP Net Income
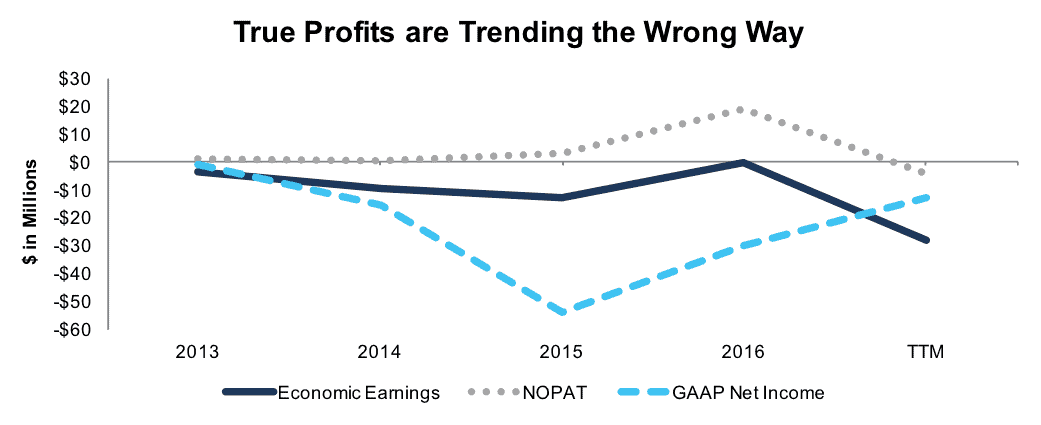
Sources: New Constructs, LLC and company filings
Further, negative free cash flow (FCF) totaled -$63 million TTM vs. -$43 million for all of 2016. In addition to lower NOPAT, the TTM period includes a 33% increase in invested capital. Since 2013, ETSY has burned a cumulative $213 million of FCF (11% of market cap). The company’s $282 million in cash currently on the books would only support the TTM cash burn rate for another four years.
Poor Return on Invested Capital
ETSY’s return on invested capital (ROIC) has averaged 3% over the past three years, while the current (TTM) ROIC of -2% is in the bottom quintile of our coverage universe. The TTM loss could be short lived due to the new-found focus on profitability. However, for ETSY to earn an adequate ROIC above the cost of capital, the company would need to earn a 7% NOPAT margin on current revenue without growing invested capital.
ETSY has proven to be margin challenged, but balance sheet efficiency and capital turnover are relatively efficient compared to the Consumer Discretionary sector as a whole. ETSY’s ratio of revenue/invested capital, or capital turnover, is 1.6 compared to 0.9 for the Consumer Discretionary sector. This ratio has been trending lower, however, as invested capital growth has outstripped revenue growth over the past few years.
Executive Comp Aligned with Misleading Metrics
We know from numerous case studies that changes in ROIC are directly correlated to changes in market value. Accordingly, we favor compensation plans that use ROIC to measure performance to ensure executives’ interests are aligned with shareholders’ interests. Revenue and non-GAAP performance targets can be an incentive to sacrifice profitability for volume, or worse, engage in acquisitions that destroy shareholder value.
ETSY’s executive compensation is structured as 20% base salary, 20% annual cash incentive and 60% long-term equity incentives. The weighting towards long-term incentives is the mechanism the board uses to align executives’ interests with shareholders. However, the intent is offset by the use of revenue growth and “adjusted EBITDA” targets as the hurdles for short-term, variable incentive comp.
As shown in Figure 3, ETSY has managed to show a generally improving trend in adjusted EBITDA, while achieving no such consistent improvement in true profit measures such as NOPAT or FCF. Further, the company has generated cumulative economic losses of -$54 million since 2013, with the TTM performance being the worst period. Until the company aligns its compensation plans with financial goals that actually constitute profits, we are not optimistic that shareholder value destruction will come to an end on its own.
Figure 3: ETSY’s Misleading Non-GAAP Metrics
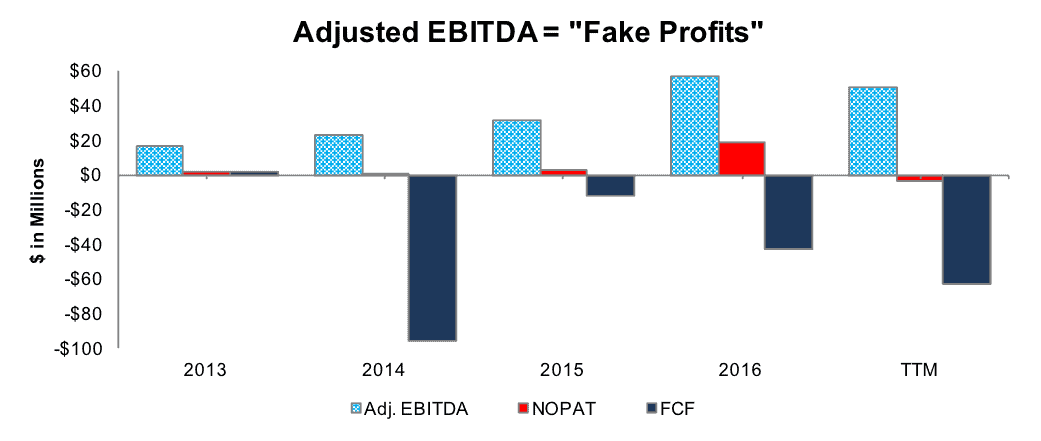
Sources: New Constructs, LLC and company filings
Formidable Competition Forces Change
ETSY is the leader in an e-commerce market it largely created, but its first mover advantage is threatened by formidable competition. Ebay (EBAY) and Alibaba (BABA) are the more similar ecommerce platforms, but Amazon (AMZN) is ETSY’s most dangerous competitor. AMZN launched “Handmade at Amazon” in October 2015 in direct competition with ETSY. About a year later, AMZN’s presence began to impact ETSY’s financials.
ETSY reacted by cutting over 20% of the workforce and making $35 million (annualized) of targeted cost reductions the focal point. We also expect the internal shift to cause cultural issues with the employee base. It was just last year that ETSY moved from a 106,000 square foot headquarters into a new two-building, 200,000 square foot headquarters that is reportedly among the most luxurious and celebrated in the world.
An abrupt growth slowdown followed by an expense reduction initiative is a sign that ETSY’s niche platform is not a sustainable competitive advantage in the cutthroat world of e-commerce. This conclusion is supported by ETSY’s