While the broader stock market rally has been strong year-to-date, large-cap technology stocks once again showed their bullish colors too. The Invesco QQQ Trust (NASDAQ:QQQ) is now higher by more than 30% since its late December 2018 lows and the exchange-traded fund is higher by more than 20% year-to-date. However, the QQQ ETF is now increasingly looking stretched on the upside and a mean-reversion trade to the downside is setting up for active investors and traders.

Earnings season is well underway but many of the large and mega-cap tech stocks are still waiting to report their latest numbers. Nonetheless, if the April rally in the QQQ ETF is any indication, investors have been giddy, gobbling up shares of these stocks right into the earnings reports. In my eye, the slope of this rally is getting all too steep for now.
QQQ ETF Charts
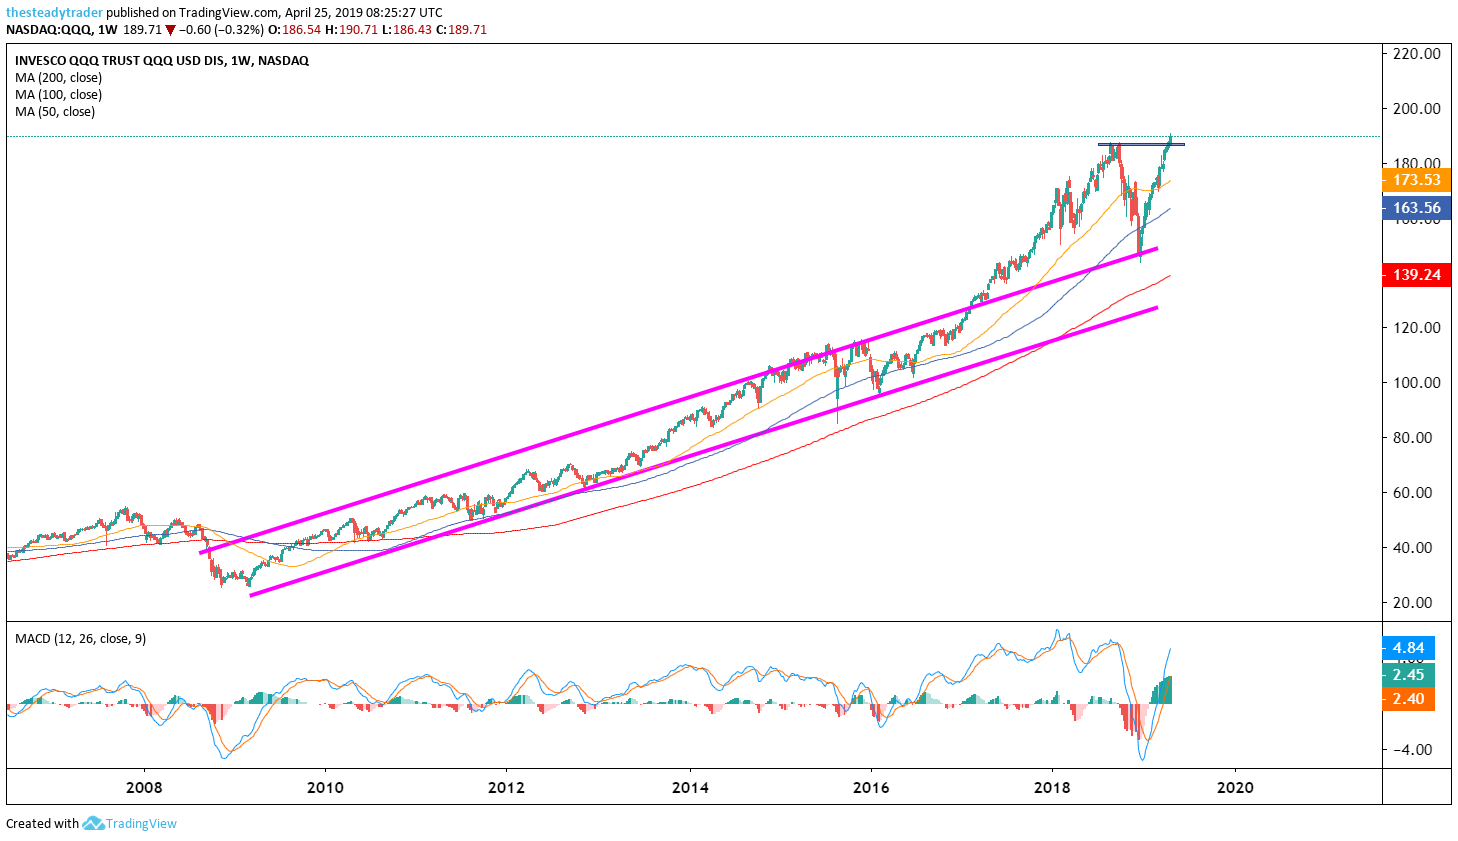
For some perspective let’s look at the longer-term multi-year chart with weekly increments and note that by September/October 2018 the QQQ ETF was severely overbought and removed from its longer-standing up-trend as marked by the two purple parallels.
Click to Enlarge
Moving averages legend: red – 200 week, blue – 100 week, yellow – 50 week
But the corrective period in Q4 2018 mean-reverted these stocks back to the upper end of the trend, where they found support. After the most recent sharp multi-month rally, the Nasdaq 100 is right back at fresh all-time highs, which in itself wouldn’t be so concerning to me if it weren’t for the straight line move higher to these levels.
A sustainable breakout to fresh all-time highs in my eye rarely if ever happens coming from severely oversold readings, all in one straight line. What is needed here at the very least is for the QQQ ETF to consolidate in a sideways to lower pattern.

Click to Enlarge
Moving averages legend: red – 200 day, blue – 100 day, yellow – 50 day
On the daily chart, we see that although the QQQ ETF has had a few breathers along the way over the past few months, these were not enough to keep the rally going to higher and sustainable all-time highs for the time being.
It is also noteworthy that from a momentum perspective as measured by the MACD momentum oscillator at the bottom of the chart the QQQ ETF has not been this overbought since late January 2018, where stocks proceeded to correct meaningfully.
Active investors and traders could now look to leg into controlled-sized (not too large) short positions in the QQQ ETF around the $190 level or higher. A first downside target is $180, while any strong bullish reversal upon an initial pullback would be a stop loss signal.
Attend Serge Berger’s special webinar: The highest probability candlestick pattern, period. Click here to register.