This morning, I’m recommending a bullish call option on Mr. Cooper Group, Inc. (NASDAQ:COOP), the home loan servicer.
My indicators are giving bullish-to-neutral readings this week, a mild downgrade from last week’s bullish readings.
The S&P 500 Index went on to hit another new all-time high of 3,050.10 following the FOMC’s rate cut announcement. However, despite the new highs, market breadth — the ratio of advancing stocks to declining stocks — is not as strong as I would expect.
There are a lot of things that should be giving bulls pause, so if we’re going to go with a bullish trade, it needs to be carefully considered.
Hope in Home Sales
Despite the market’s new highs, the underlying economy in the U.S. continues to slow, albeit not as much as the rest of the world’s major economies.
While the latest gross domestic product (GDP) reading came in at a better-than-expected 1.9% annualized rate in the third quarter, that figure was down from the second quarter’s reading of 2%.
Manufacturing also continues to decline, as evidenced by the Chicago Purchasing Managers’ Index (PMI) reading for October. That number came in at 43.2, which was the lowest reading since December of 2015 and well below the expectation of 48.3.
As my regular readers know, the PMI data is measured on a scale from zero to 100, where any reading below 50 indicates contraction.
These readings don’t fill me with optimism, but there are still good signs out there.
Earlier this week we got a read on Pending Home Sales, which showed a 1.5% increase in the number of existing homes put under contract since September. Sales were 3.9% higher than September of 2018, as interest rates have fallen significantly since then.
And, the jobs report released on Wednesday showed a decent addition of 125,000 new jobs in October, and wages also continue to rise on a year-over-year basis.
More jobs could mean more home buying in the near future, and someone will have to help service all those new home loans. COOP is likely to see even more business if home sales continue to increase.
The Bullish “Golden Cross”
As you can see in the chart below, COOP’s 50-day moving average (MA), which is represented by the blue line, has crossed above its 200-day MA, which is represented by the orange line. This technical formation is known as a “golden cross,” and it can be a sign that a major rally is coming.
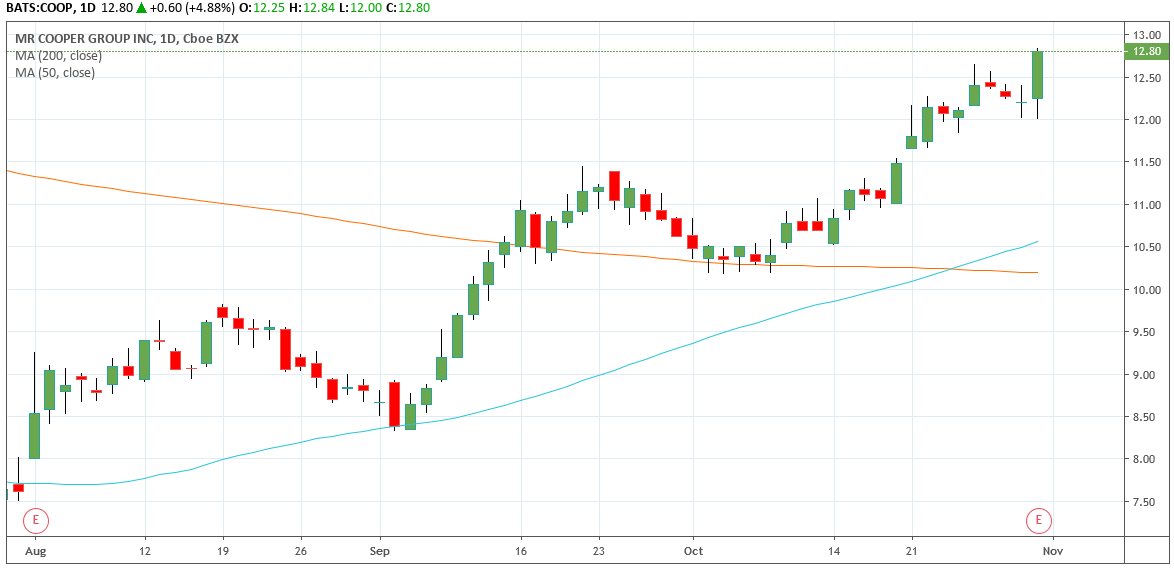
Daily Chart of Mr. Cooper Group, Inc. (COOP) — Chart Source: TradingView
COOP has already pushed above resistance just above $12. The next level it needs to overcome is just above $13, and that resistance formed back in March. With interest rates continuing to drop and jobs getting added to the economy, I think COOP could push even higher.
Buy to open the Mr. Cooper Group, Inc. (COOP) Dec. 20th $12.50 Calls (COOP191220C00012500) at $1.15 or lower.
To receive further updates on this trade, as well as an alert when it’s time to take profits, sign up for a risk-free trial of Power Options Weekly today.
InvestorPlace advisor Ken Trester brings you Power Options Weekly, which delivers 5 new options trades and his latest trading advice to you each Friday. Trester has been trading options since the first exchanges opened in 1973 with a winning streak that goes back to 1984 with money-doubling average annual profits since 1990.