
Supply and demand determines the price of a stock. If understood and applied correctly, technical analysis should be an illustration of these dynamics. In order to really understand these dynamics, we can look at the lessons learned from certain penny stocks.
Unfortunately, many investors look for patterns without really understanding what they mean. Even worse, some analysts are proponents of strange methods like Elliot Waves and Gann Theory. These techniques are like Sasquatch. They may be fun to talk about, but they aren’t real. No one in the institutional investment world uses them.
But what is real is that, in financial markets, there are certain price levels that are more important than others. Sometimes there doesn’t seem to be reason for the importance. But sometimes the reason is obvious. For example, nice round levels like $20 or $100 are important. People are more likely to place limit orders at round levels, so there tends to be more support and resistance at them than other levels.
Another truth about the markets is that prices are always doing one of three things. They are either going up, going down or staying the same.
If understood and applied correctly, technical analysis should illustrate these dynamics. And this could lead to profits.
The following seven penny stocks all show important technical analysis lessons:
- First Trust New Opportunities MLP & Energy Fund (NYSE:FPL)
- Arlington Asset Investment (NYSE:AAIC)
- Emerald Holding (NYSE:EEX)
- Probe Metals (OTCMKTS:PROBF)
- Armstrong Flooring (NYSE:AFI)
- Astro Aerospace (OTCMKTS:ASDND)
- CPI Aerostructures (AMEX:CVU)
Penny Stocks: First Trust Opportunities MLP & Energy Fund (FPL)
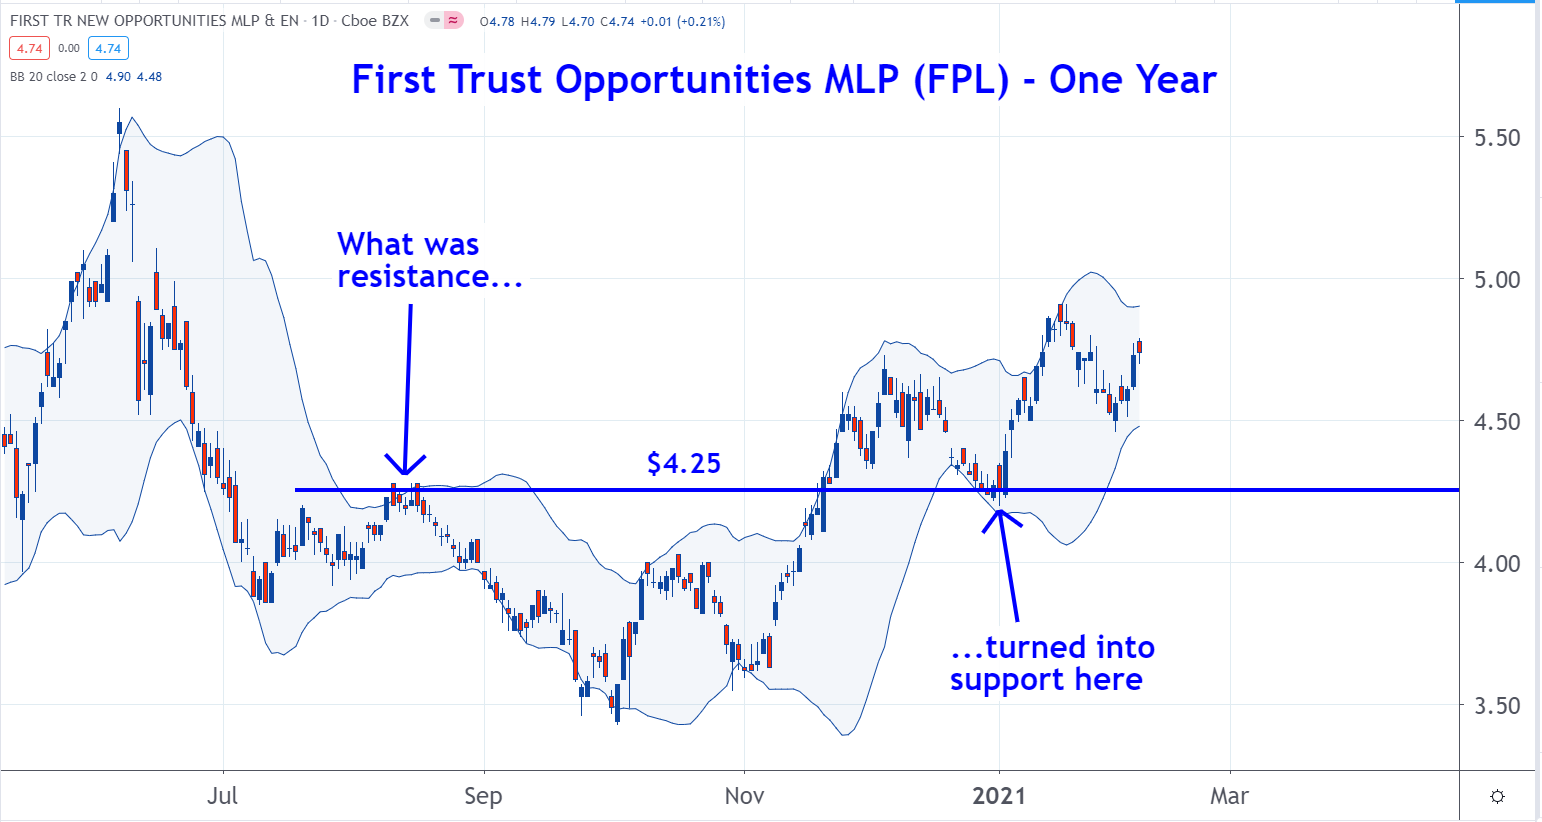
Chart by TradingView
First Trust New Opportunities MLP & Energy Fund is a closed-ended mutual fund. It makes investments in the energy sector. The current market capitalization is about $122 million.
The recent action of FPL shows an important principle of financial markets. In bull markets, levels that had been resistance can turn into support.
As you can see on the chart, the $4.25 level was resistance for FPL in August. Then in late December/early January, it converted into support.
The reason for this is remorseful sellers. These are the ones who sold FPL in August. When the stock traded lower afterwa, these sellers believe they made the right decision.
But in November, FPL rallied and broke through the $4.25 level. Now these sellers believe they made a mistake when they sold. A number of them decide to buy FPL back … if they can get it for the same price they sold at.
This results in them placing buy orders at a level that had been resistance. If there are enough of these buy orders, the level becomes support. This is what we see here with FPL and the $4.25 level.
Arlington Asset Investment (AAIC)
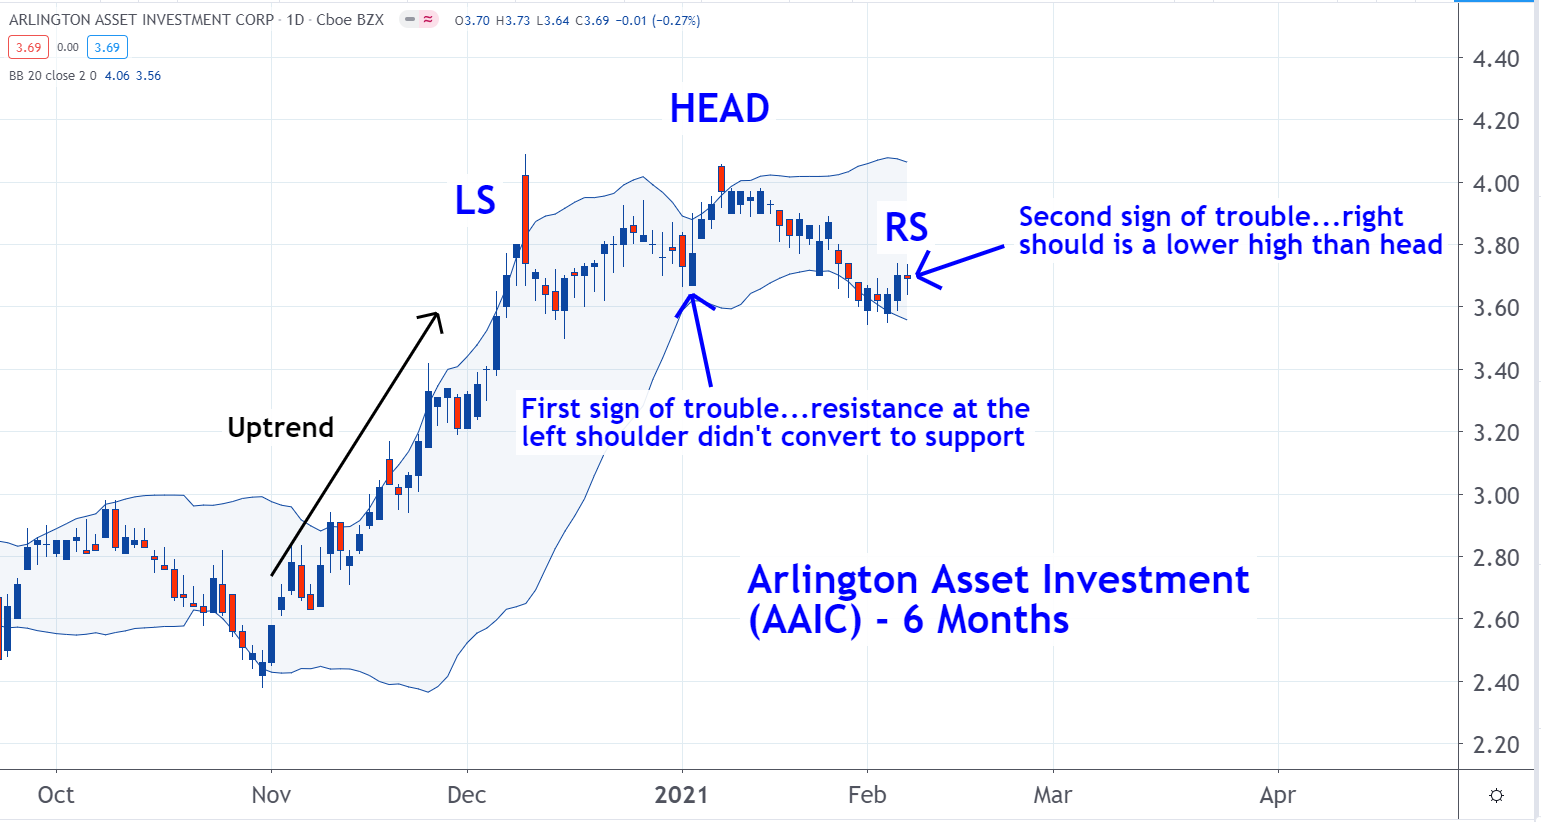
Chart by TradingView
Next on this list of penny stocks to learn from is AAIC. Arlington Asset Investment is a firm that invests in mortgage-related assets. The market cap is about $124 million.
AAIC could be forming a classic head-and-shoulders (H&S) pattern. This pattern is well known, but they don’t occur often. Most technical analysts don’t understand it.
The H&S pattern shows a reversal. That means it has to come at the end of an uptrend or downtrend. If a market is trading sideways and an analyst believes an H&S pattern has formed, they are wrong.
It isn’t important to remember the names of technical patterns. What is important is to understand what they are illustrating with regards to supply-and-demand dynamics occurring in the market.
We have seen that resistance levels can become support levels. In the H&S pattern, the first sign of trouble is when the resistance that is the left shoulder of the pattern does not become support. This could mean that the trend is about to end.
Emerald Holding (EEX)
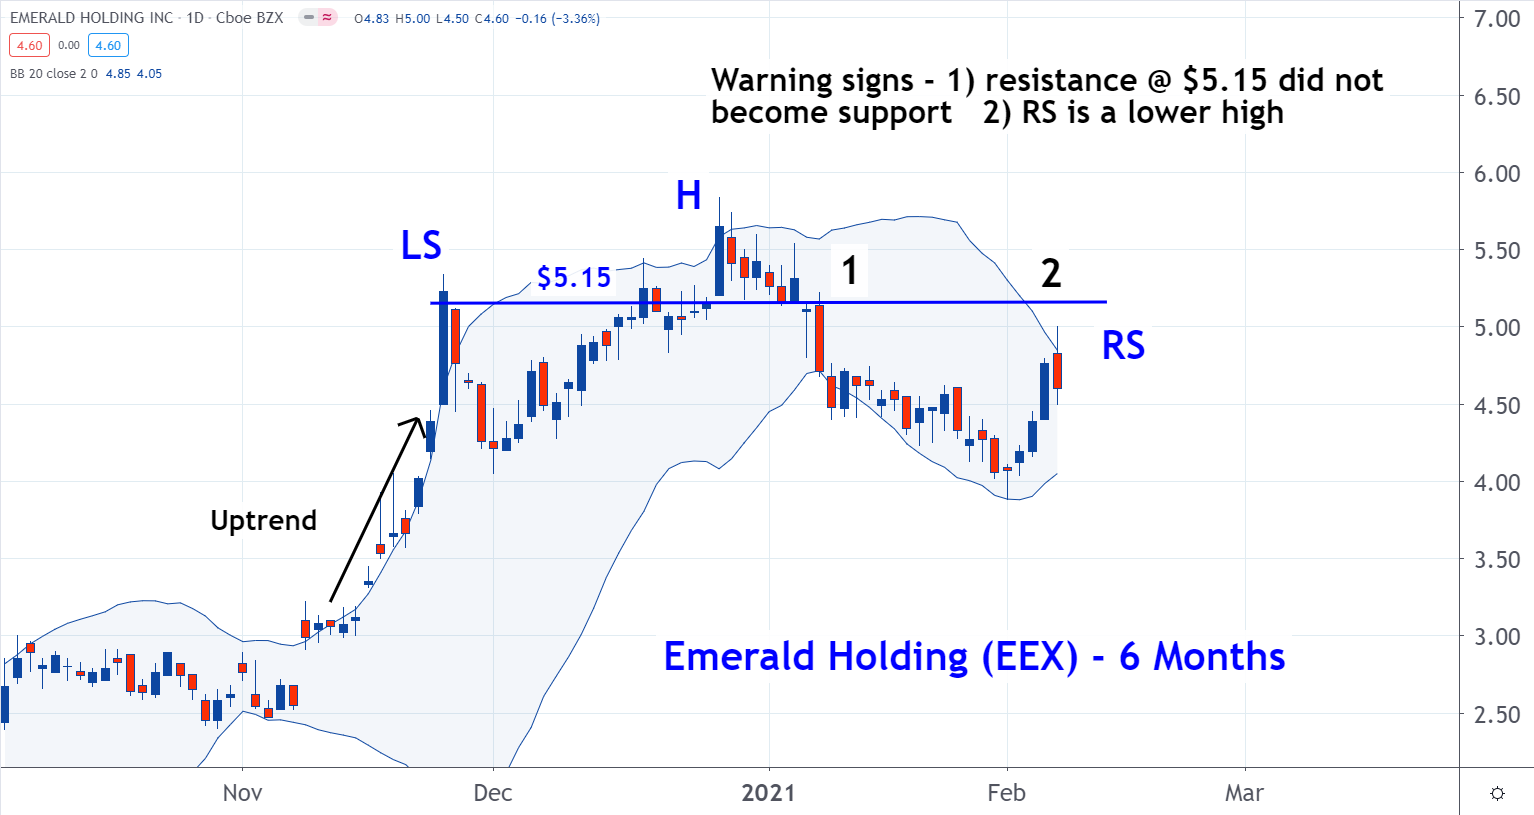
Chart by TradingView
Emerald Holding operates trade shows. The stock of this company may also be forming a head-and-shoulders pattern.
As you can see on the chart, the first sign that there may be trouble ahead was when the resistance that was the left shoulder didn’t turn into support. This is #1 on the chart. This was a signal that the previous uptrend was ending.
The second sign of trouble in the pattern is when the right shoulder doesn’t reach the same height as the head. See #2 on the chart. This is called a “lower high.” It is a sign of weakness. It shows that as time has passed, the buyers aren’t willing to pay as high of a price as they previously had.
When the head of the pattern formed, buyers were willing to pay over $5.50 a share for EEX. But during the right shoulder a month later, they were only willing to pay about $4.75.
These two bearish dynamics, the resistance of the left should not converting into support and the right shoulder forming a lower higher than the head, is what defines this pattern. They would suggest the stock is on the verge of a sell-off.
Probe Metals (PROBF)
<div class="mcp-article"></div> Chart by TradingView
Probe Metals acquires, explores and develops gold properties in Canada.
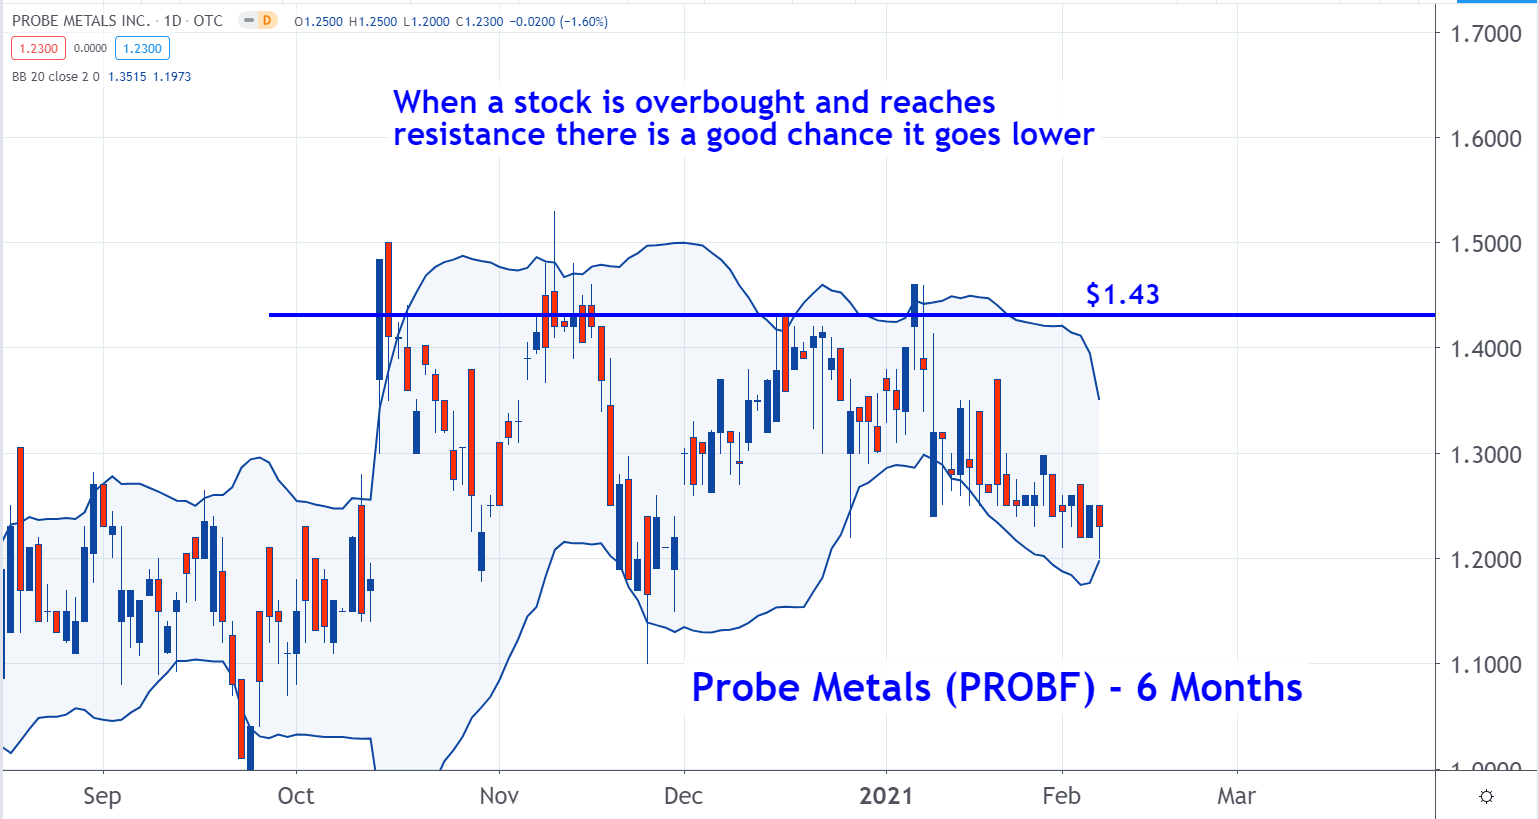
This stock shows an important market dynamic. When stocks are overbought and they reach resistance, they tend to sell off.
As you can see on the chart, in October PROBF hit resistance around $1.43. This level has been resistance since then. That means there is a large concentration of sellers at the level.
Overbought is a term that refers to a stock’s momentum. The wavy blue lines on the chart are two standard deviations above and below the recent average price of PROBF.
Probability theory states that 95% of all trading should be within two standard deviations of the average. When the stock exceeds this threshold to the upside, it is considered to be overbought.
This condition draws sellers into the market. That is what happened here each time PROBF has reached the $1.43 level since October.
Armstrong Flooring (AFI)
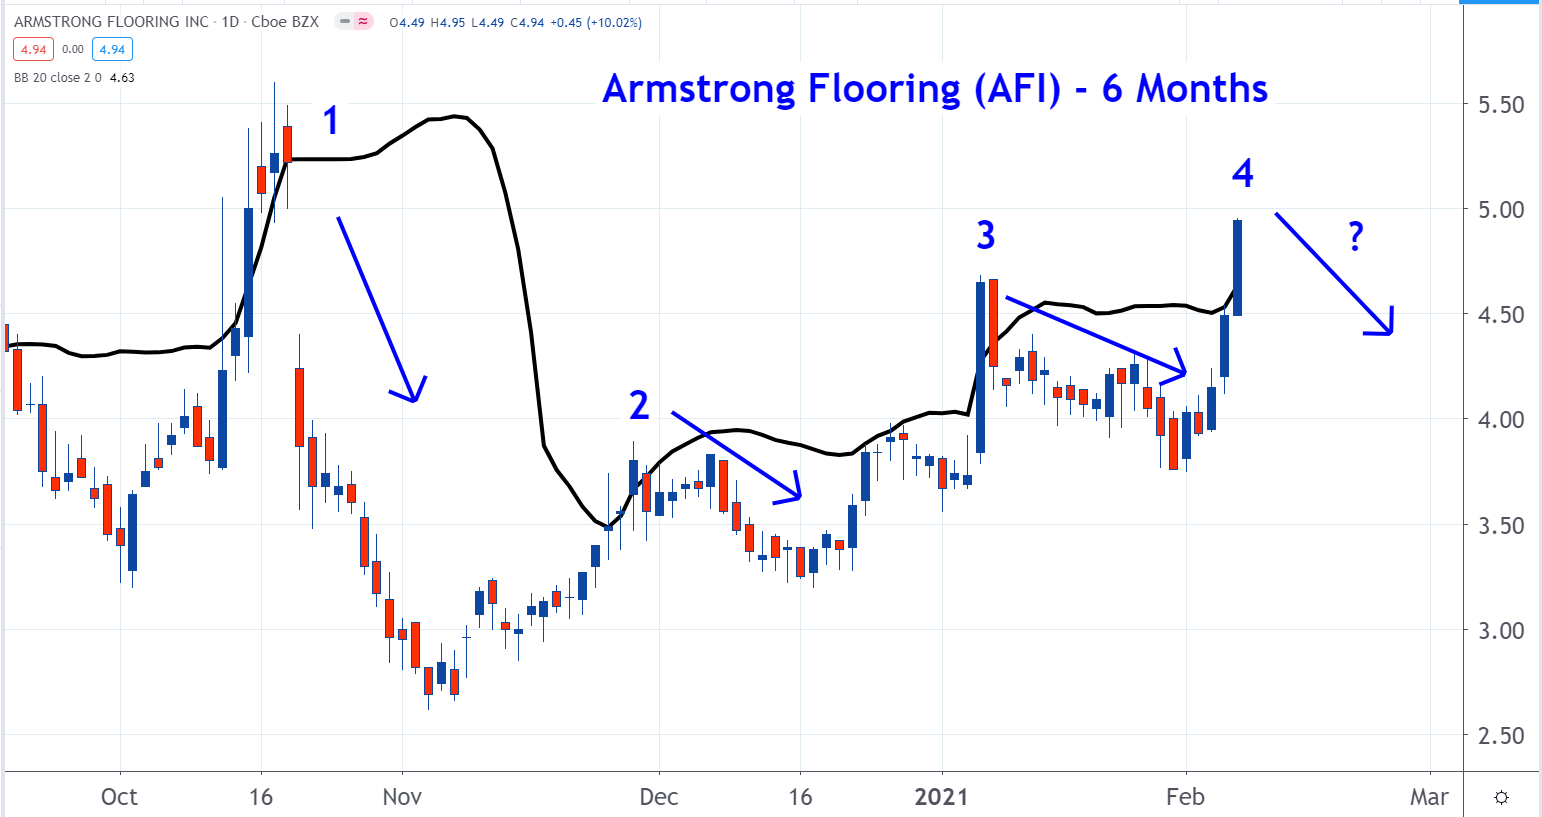
Chart by TradingView
Armstrong Flooring designs, manufactures and sells flooring products used in the construction industry. The market cap is $108 million, and the company is based in Lancaster, Pennsylvania.
This penny stock is also overbought. Unlike Probe Metals, there are no clearly defined resistance levels for AFI. But the last three times that it was overbought, it has sold off as well.
The black line on the above chart is two standard deviations above the recent 20-day average. Probability theory states that 95% of all trading should be under this threshold.
Many of today’s automated and computerized algorithms are based on statistics and probability theory. When a stock is overbought (or oversold), it will be targeted by these algorithms.
As you can see on the chart, the past three times that shares of AFI exceeded this threshold, a sell-off followed. Now AFI is above it again. There’s a good chance that the sellers knock it lower once again.
Astro Aerospace (ASDND)
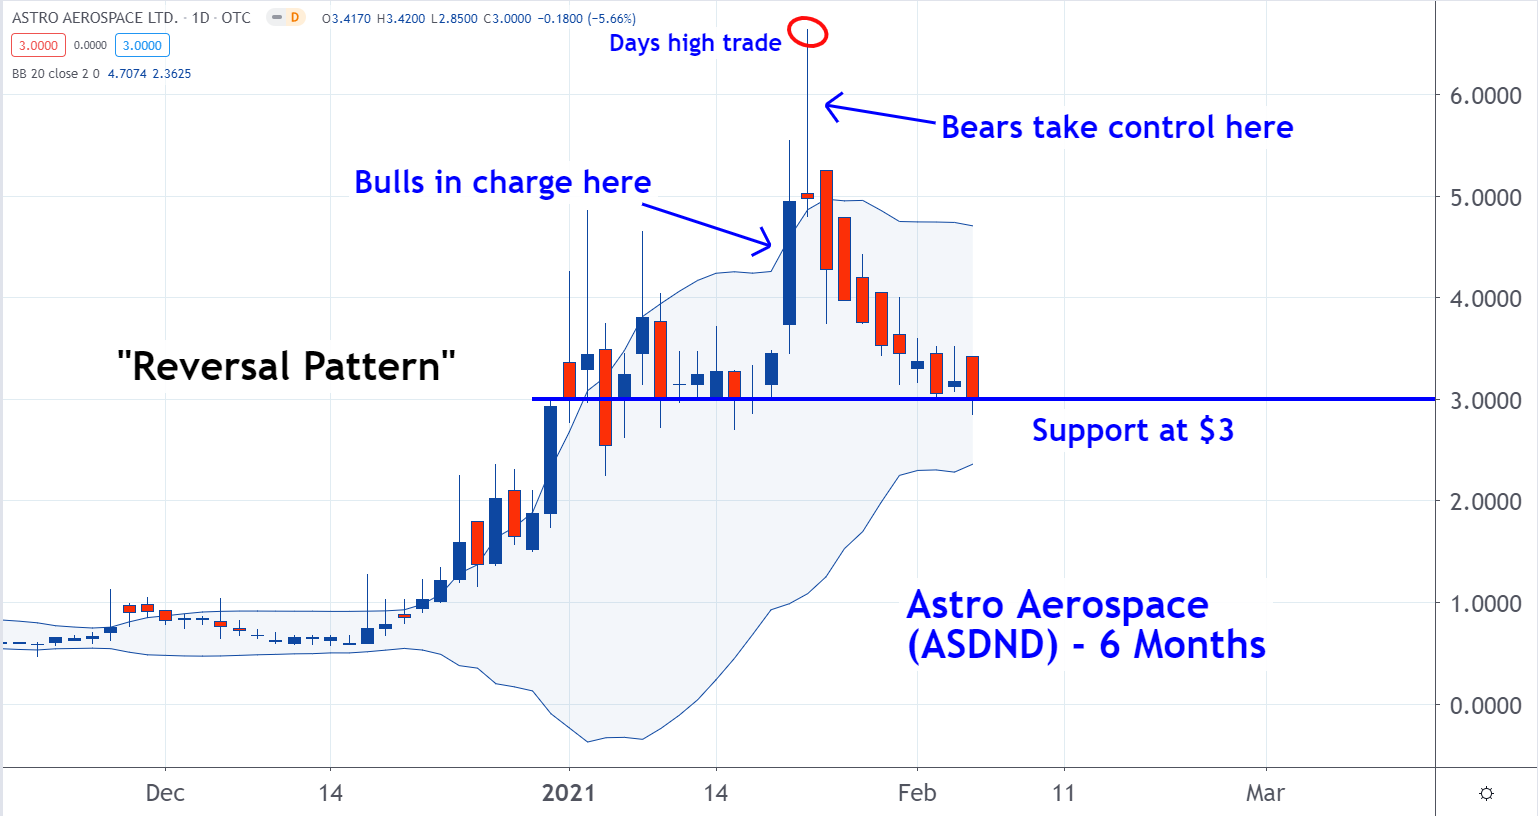
Chart by TradingView
Next on our list of penny stocks is Astro Aerospace. ASDND develops and builds self-piloted and autonomous aerial vehicles. This stock shows a classic reversal pattern.
When stock prices are moving higher, the bulls are in control. When they are moving lower, it’s the bears who are in charge. A reversal pattern shows a chance of the leadership.
On the above chart, the blue rectangles are up days. The stock opened at the bottom of the rectangle and closed at the top.
The red days are down days. The top of the red rectangle is the opening price, and the bottom is the closing price.
On Jan. 21 the stock opened near the the day’s lows. It rallied over the course of the day and ended up closing near the days highs. The bulls were clearly in charge. This is the blue vertical rectangle.
Then, on Jan. 22, ASDND opened and made a big move higher. But by the end of the day, it reversed and closed near the low price of the day. This means that the bears took control of the market. This action appears as a reversal pattern on the chart.
CPI Aerostructures (CVU)
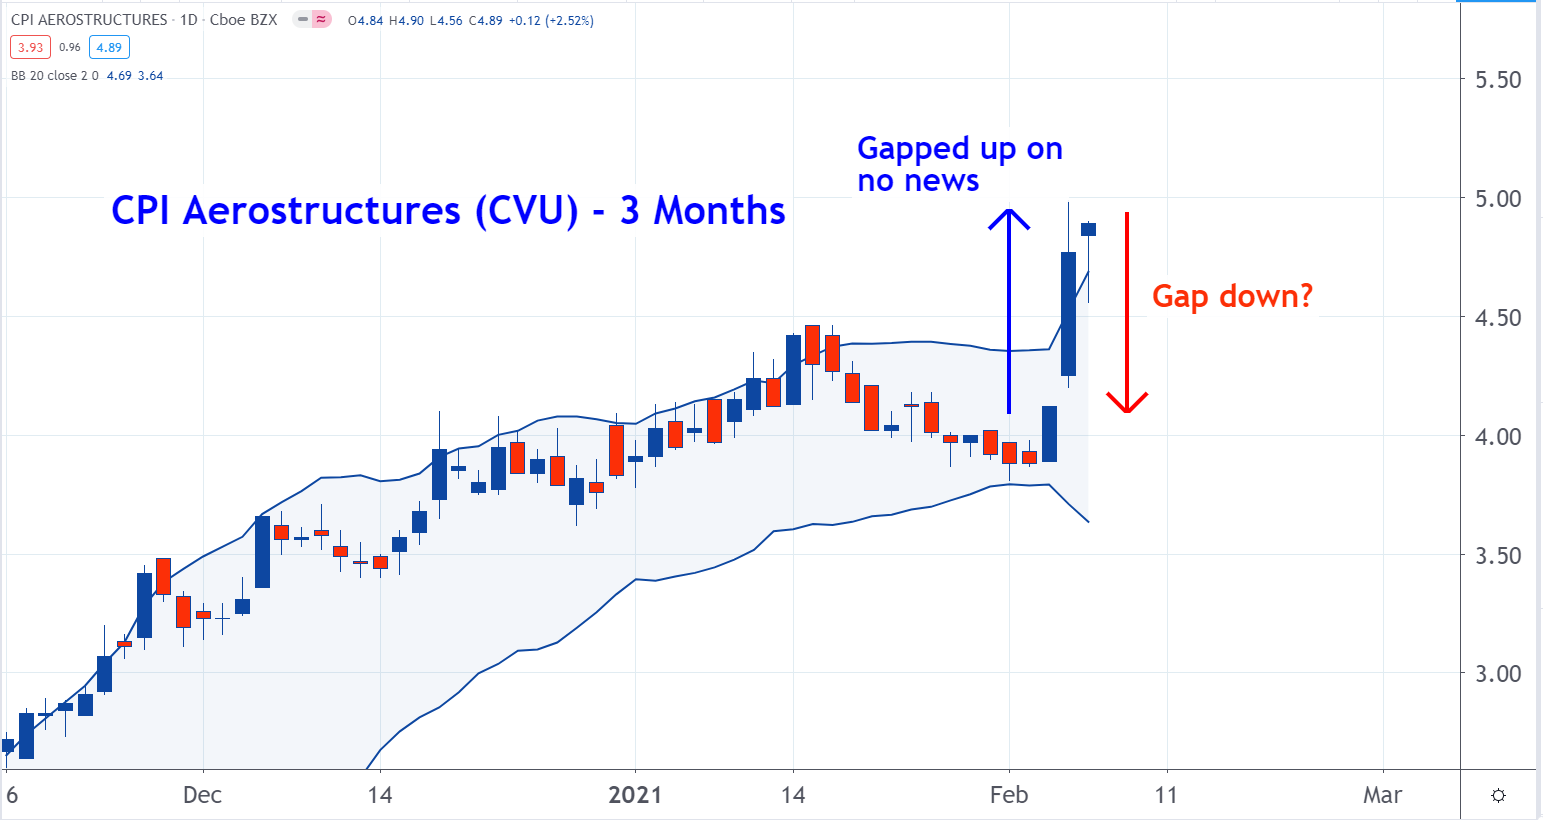
Chart by TradingView
CPI Aerostructures builds aircraft parts for fixed-wing aircraft and helicopters in the commercial and defense industries. The market cap is about $60 million. The company was founded in 1980 and is based in Edgewood, New York.
The lesson from this entry on our list of penny stocks is in market action. As you can see here, last week CVU gapped up and became overbought. However, there is no new news related to this company. When a stock rips higher like CPI Aerostructures did and there isn’t a good reason for it, they tend to rollover and go back to where they were when the move started.
Unfortunately for the people who bought Gamestop (NYSE:GME) over the past few weeks, they are learning this the hard way. GME will probably fall back to $20. This is a big difference from two weeks ago when it reached $480.
There is a good chance that the investors who bought CVU when it gapped up may soon learn the same lesson.
At the time of this publication, Mark Putrino did not have any positions (either directly or indirectly) in any of the aforementioned securities.