
In everything from blue-chips to penny stocks, technical analysis is widely misunderstood. This isn’t surprising. Most analysts mindlessly look for patterns on charts without understanding just what it is that they are supposed to illustrate. Even worse, some analysts are proponents of bizarre methods like Elliot Waves and Gann Theory.
These techniques may be be fun to talk about, but they aren’t real. Serious institutional traders don’t waste their time with them and you shouldn’t either.
But what is real is that in financial markets, there are some price levels that are more important than others. In addition, prices are always doing one of three things. They are either going up, going down, or staying the same.
If understood and applied correctly, technical analysis is analysis of the supply and demand dynamics that are occurring in a market. It should be a way to identify and study these trends and levels in penny stocks and beyond.
If an investor understands which levels and trends are important, they can predict when the trend in the market is changing. With this knowledge, it is easy to understand how they can profit.
Here is some technical, or supply and demand, analysis of seven penny stocks.
- Image Sensing Systems (NASDAQ:ISNS)
- ClearSign Technologies (NASDAQ:CLIR)
- Southwestern Energy (NYSE:SWN)
- Entravision Communications (NYSE:EVC)
- Contango Oil & Gas (NYSEAmerican:MCF)
- LSB Industries (NYSE:LXU)
- Gulf Island Fabrication (NASDAQ:GIFI)
Penny Stocks: Image Sensing Systems (ISNS)
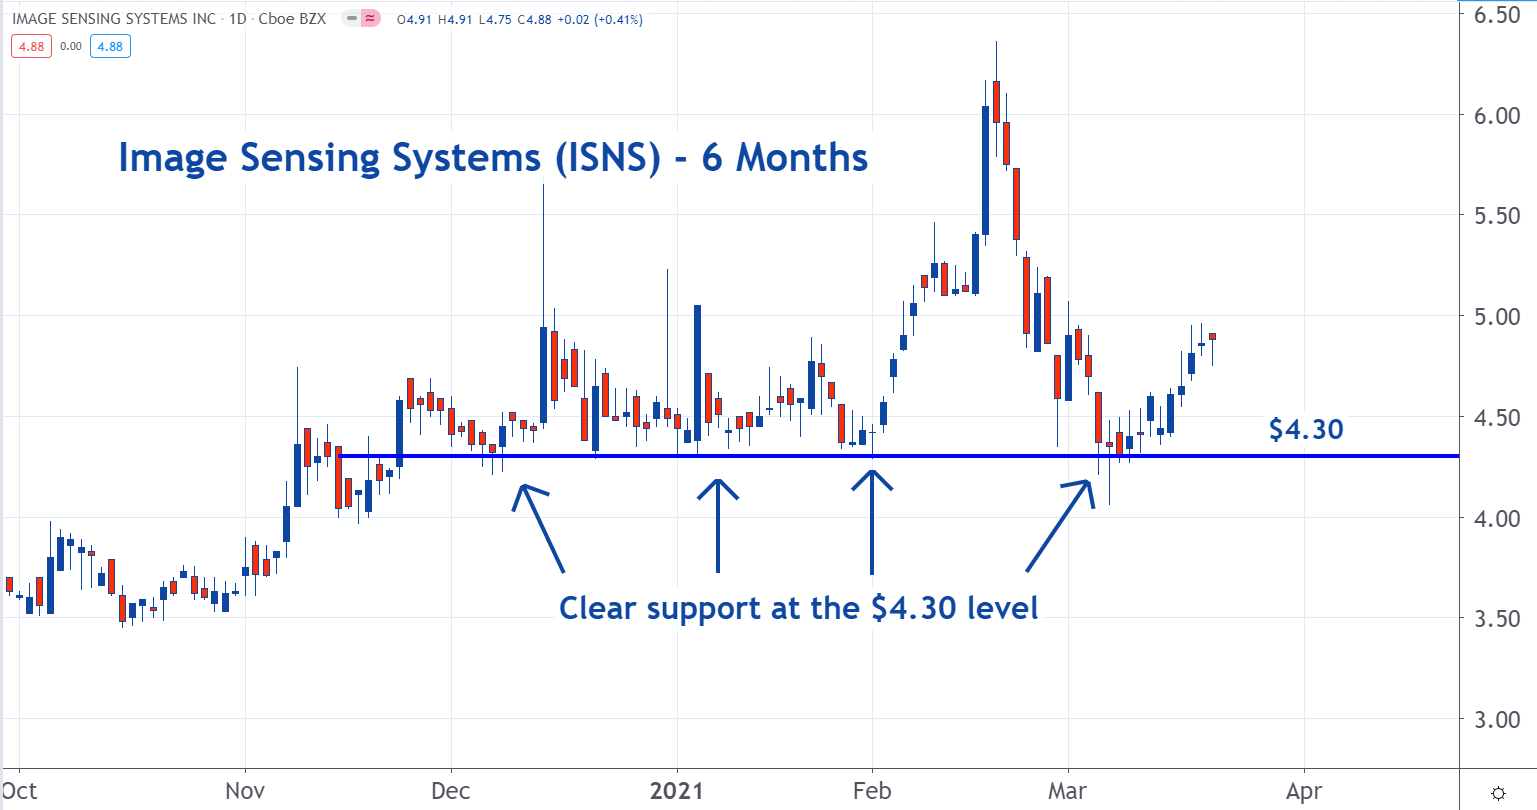
Chart by TradingView
Image Sensing Systems builds and sells video and radar processing products for the intelligent transportation systems industry, with clients worldwide. The company was founded in 1984 and is based in Saint Paul, Minnesota.
The $4.30 level is what is known as a support level. At support levels, there is more than enough demand to absorb all of the supply of shares. This means that sellers can sell all they need to without a fear of pushing the price any lower. When stocks or markets are in downtrends, they often pause or reverse when they get to support levels.
When a stock that is in a downtrend reaches a support level and reverses its trend and moves higher, it is because buyers in the market get the sense that there are large buyers around … i.e. the ones that formed the support. Some investors start to buy the stock because they are afraid these large buyers will eventually come off of their prices levels and push it higher. These investors want to get in ahead of this. This is what causes the rebound.
ClearSign Technologies (CLIR)
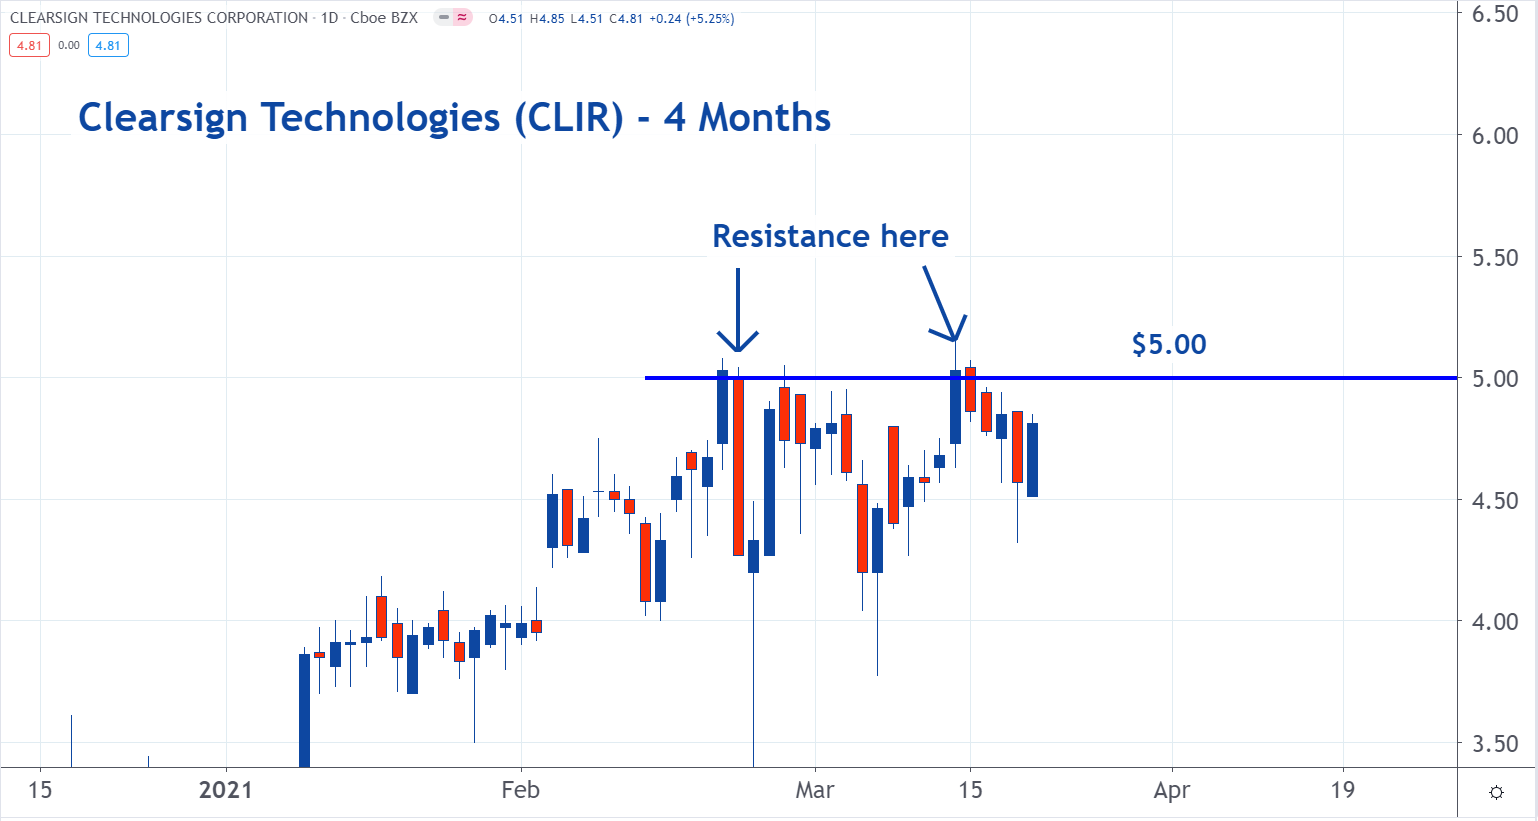
Chart by TradingView
ClearSign Technologies designs and develops products to improve operational performance and cost-effectiveness for industrial and commercial systems in the United States. ClearSign Technologies Corporation was founded in 2008. Its headquarters are in Seattle, Washington.
Here we have the opposite situation. The $5 level — the upper price level for penny stocks — is what is known as a resistance level. At resistance levels, there is more than enough supply to satisfy all of the demand for shares. This means that buyers can buy all they need to without a fear of pushing the price any higher. When stocks or markets are in uptrends, they tend to pause or reverse when they get to resistance levels.
When a stock that is in a uptrend reaches a resistance level and reverses its trend and moves lower, it is because sellers in the market get the sense that there are large sellers around … i.e. the ones that formed the resistance. Some investors start to sell the stock because they are afraid these large sellers will eventually come off of their prices levels and push it lower. These investors want to get in ahead of this. This is what causes the downtrend to begin.
Southwestern Energy (SWN)
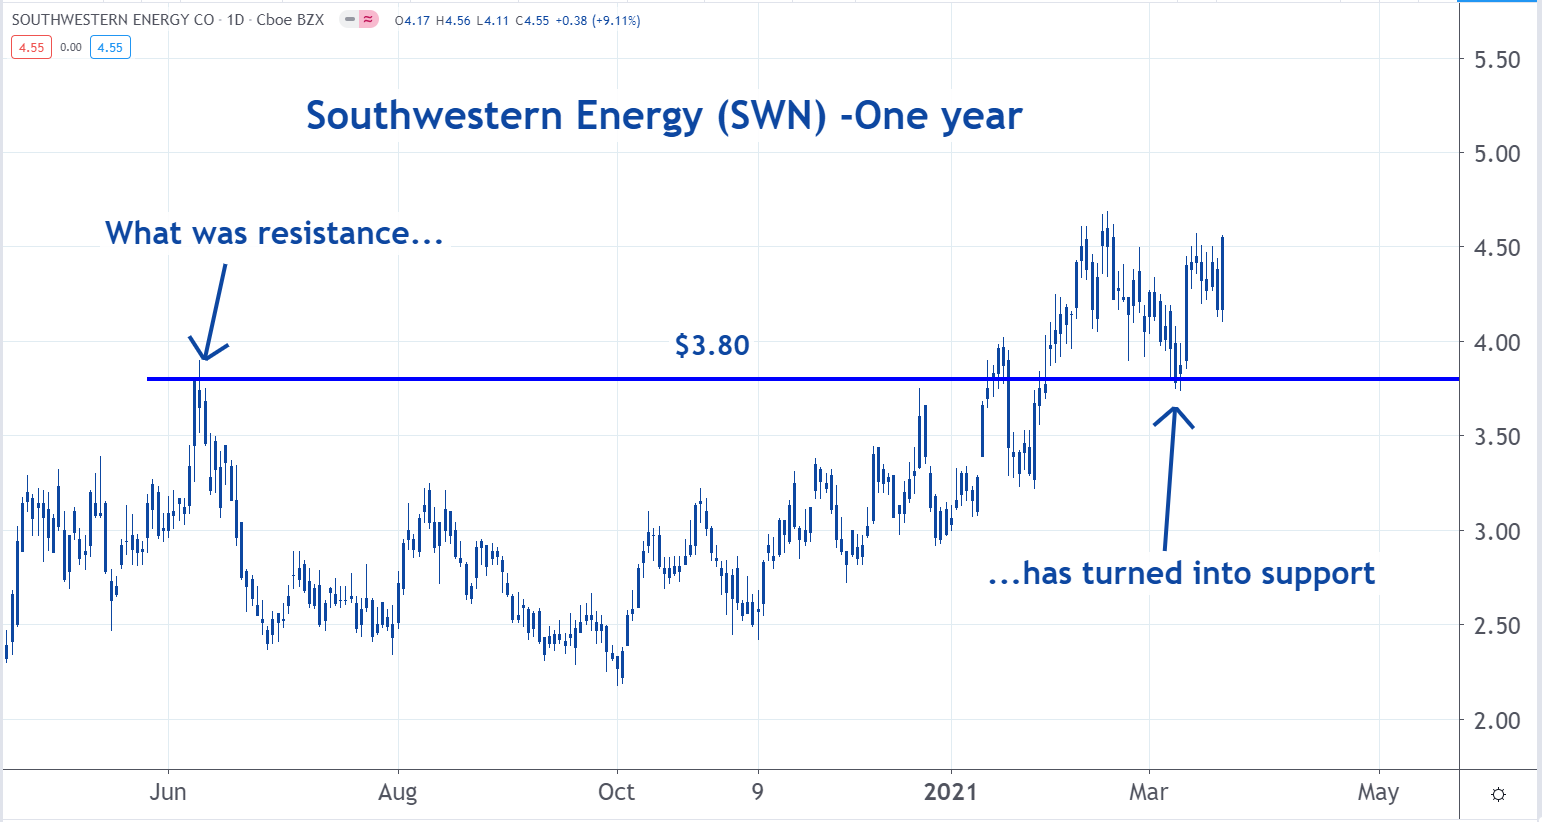
Chart by TradingView
Southwestern Energy is an independent energy company working in the exploration, development, and production of natural gas and oil. The company was incorporated in 1929 and is headquartered in Spring, Texas.
This stock shows a dynamic that happens frequently in the markets. Here we see an example of how a prior resistance levels can convert into support levels.
Resistance turns into support because of remorseful sellers. They sold the stock at $3.80 in June while was at resistance. They believe they made a good decision when the stock trended lower afterwards.
But when the stock rallied and broke through this resistance, a number of these investors regret their decision to sell. Many decide to buy it back, assuming they can get it for the same price they sold it for.
This results in buy orders being placed at $3.80, the level that had been resistance. If there are enough of these buy orders, support forms like we see here.
Entravision Communications (EVC)
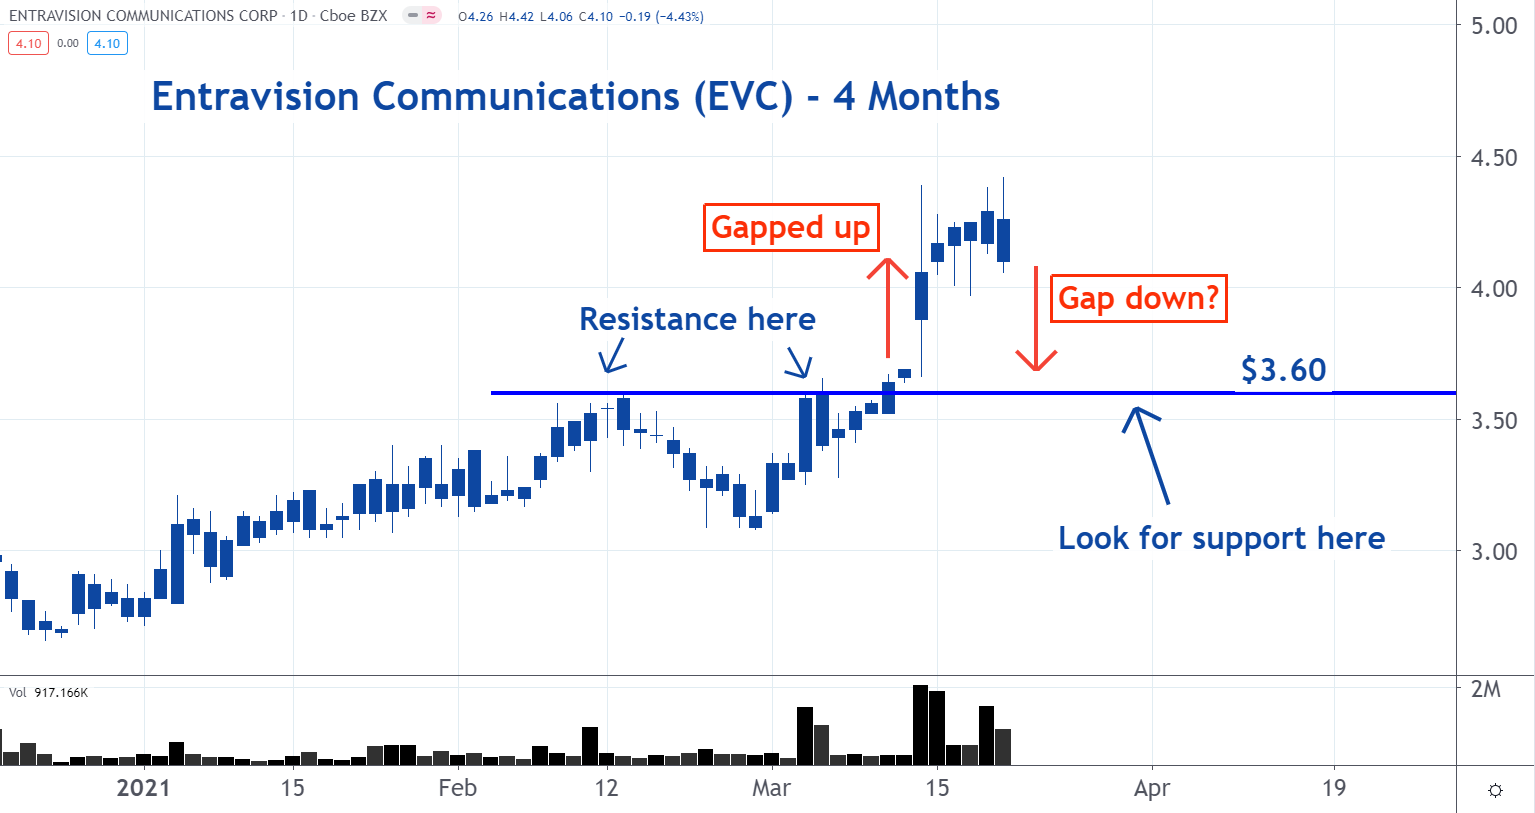
Chart by TradingView
Entravision Communications is a media companyoperating primarily in the United States, Spain, Mexico, Argentina, and other Latin America countries.
There’s an old saying on Wall Street that “gaps refill.’ It’s true.
As we have seen, when stocks trade higher, many investors who sold regret doing so. Some vow to buy their stock back… if they can get it at the same price. This results in buy orders being placed at levels that they had sold at. This creates support.
The longer a stock trades at a particular level, the stronger the support will be. This happens because as time passes, the number of sellers increases. So, when the stock moves higher, there are a large number of remorseful sellers who may start placing buy orders.
But in the situation of a gap, the stock only spends a small amount of time at each level that it trades through. Because of this, there will only be a small number of these remorseful sellers entering buy orders. There is only a little vested interest within the range.
So, when stocks spike up through a price range, they may also make a fast move back down through the same range.
This means EVC could gap down. If it does, look for support around $3.60…the prior resistance level.
Contango Oil & Gas (MCF)
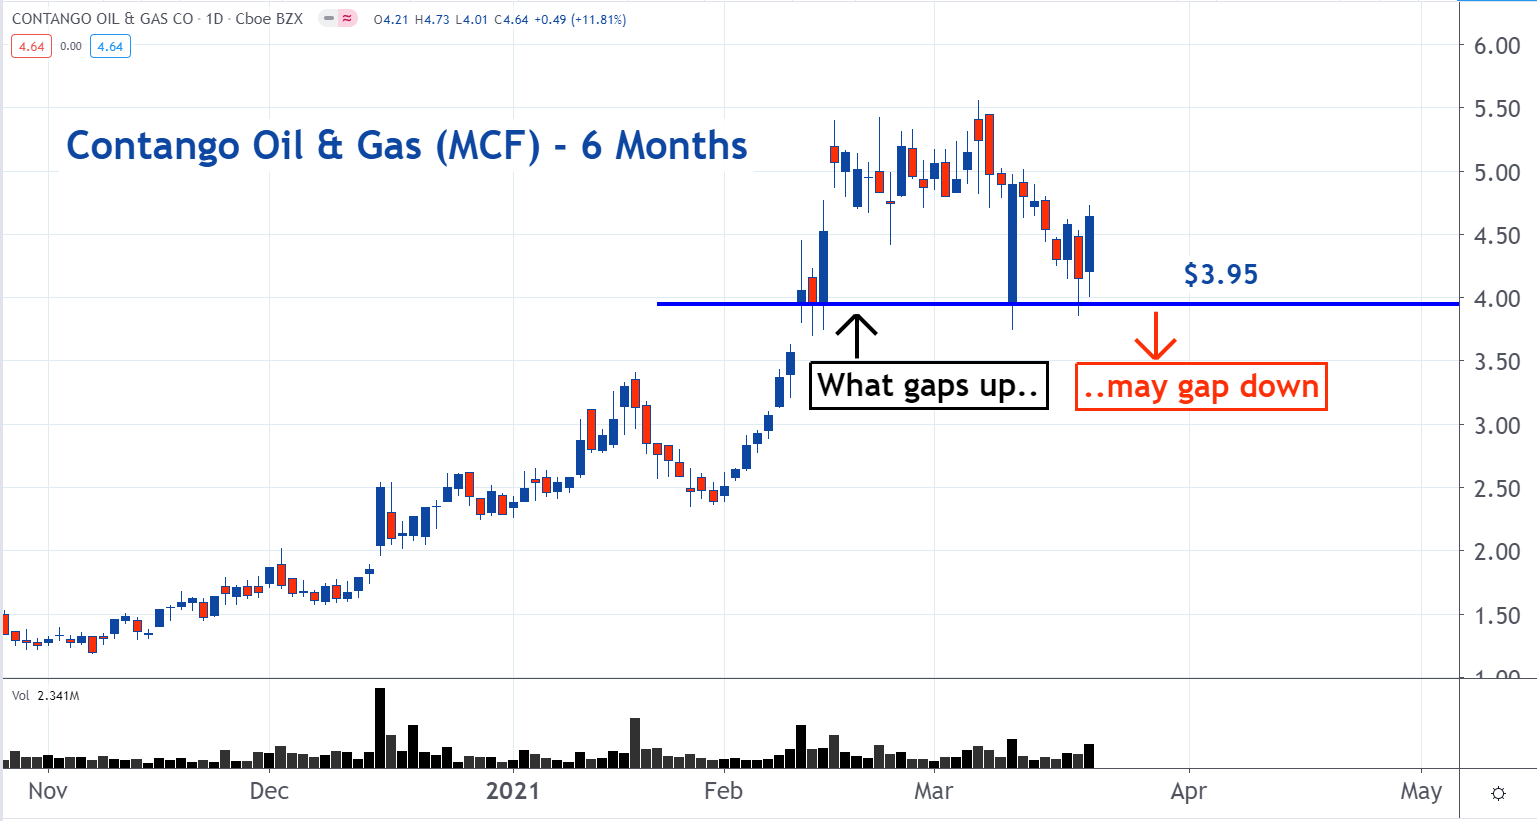
Chart by TradingView
Contango Oil & Gas is an independent oil and natural gas company. It has offshore properties in the shallow waters of the Gulf of Mexico and onshore properties in Texas, Oklahoma, Louisiana, and Wyoming.
Here we see another situation where a gap may refill. As you can see on the above chart, MCF gapped up from $3.50 to $3.95 in February. You can also see that the $3.95 level is support.
Shareholders need to be careful here. If the support level breaks, it will mean that the buyers who provided the support are done. They have either cancelled or finished their orders. Either way, it will be a sign that significant amounts of demand are now out of the market.
As we explained, we a stock gaps up there usually isn’t a lot of demand within the range it gapped through. That means MCF could suffer a steep decline before finding support around $3.50.
LSB Industries (LXU)
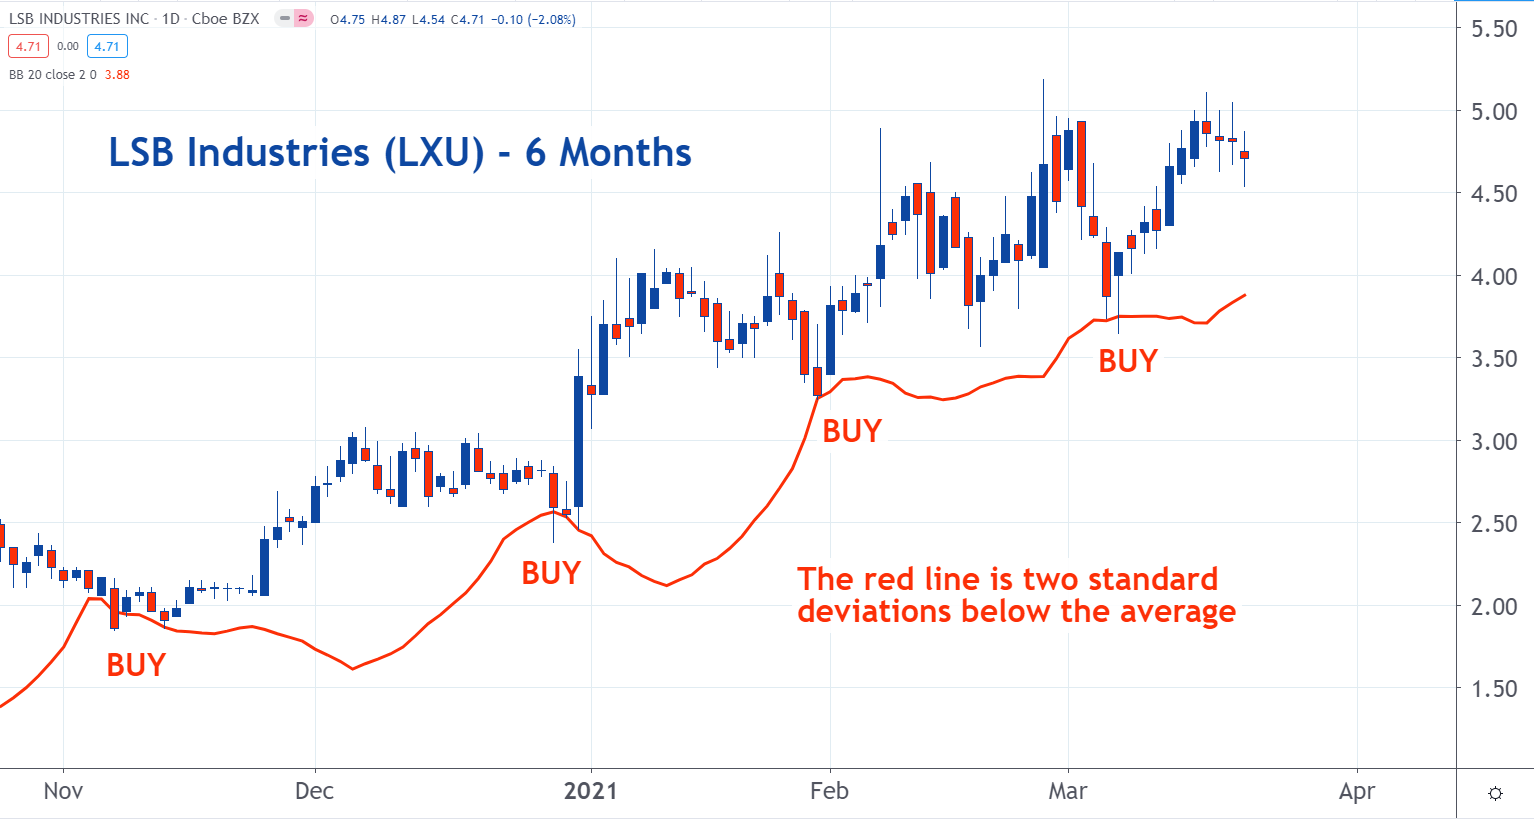
Chart by TradingView
LSB Industries makes, markets and sells chemical products in the United States. LSB Industries was founded in 1968 and is headquartered in Oklahoma City.
This stock can teach us an important trading lesson about momentum. When stocks are oversold, it may be a good time to buy them.
The vast majority of trading algorithms are based on statistical probability theory. And it says that all trading should be within two standard deviations of the average. If a stock or market exceeds this threshold, it means the momentum has reached an extreme. Traders will come into the market expecting a reversion to the average. It the case of being oversold, it means a move higher.
The red line on the chart is a Bollinger Band. This is a standard feature on trading platforms or software. It is two standard deviations below the 20-day moving average price.
As you can see, over the past six months each time shares of LXU fell below this threshold, it was a good time to buy. The stock reverted back into it recent average range.
Gulf Island Fabrication (GIFI)

Chart by TradingView
Gulf Island Fabrication builds steel structures and marine vessels in the United States, featuring three segments: fabrication, shipyard and services. It was founded in 1985, and its headquarters are in Houston, Texas.
On this chart, we can see some of the dynamics we have explained in the previous examples.
As you can see, in October the $3.75 level was resistance for GIFI in October. It was also resistance again in January. Then in early February it blasted through this resistance and traded higher.
Then, there were enough remorseful buyers who placed their buyer orders at $3.75 for support to form. GIFI bounced off of this level in early March. It had become a support level.
Remember, as you’re looking at penny stocks, technical analysis is a study of supply and demand dynamics that are occurring within a market. If understood and applied correctly, it will lead to profits.
At the time of this publication, Mark Putrino did not have any positions (either directly or indirectly) in any of the aforementioned securities.