Luke Lango’s PSTX trade takes off … what went into the recommendation? … analyzing a trade that could be on the verge of a blast-off … are you willing to follow price-action exclusively?
Let’s begin with the chart of a biotech company called Poseida Therapeutics (PSTX).As you look at this 30-month chart, what do you see?Specifically, as of late-November last year, was it a good time to enter a bullish trade on Poseida?

Hold onto your answer for a moment. We’ll circle back shortly.
Last week, Luke Lango held a special live event that explained the details of his computer-based trading service, Breakout Trader
The foundation of the service is something called “Stage Analysis.”Here’s Luke to explain what this is:
There’s always a bull market somewhere. You just have to find it.And the best way to find it is by performing something called “stage analysis.”Long story short, every stock at any given point in time is either going up, down, or sideways.To that end, every stock is always in one of four unique stages: 1) going sideways at a bottom, 2) going up, 3) going sideways at a top, or 4) going down.Stage analysis is the science behind figuring out which of these four stages a stock is in at any given point in time.
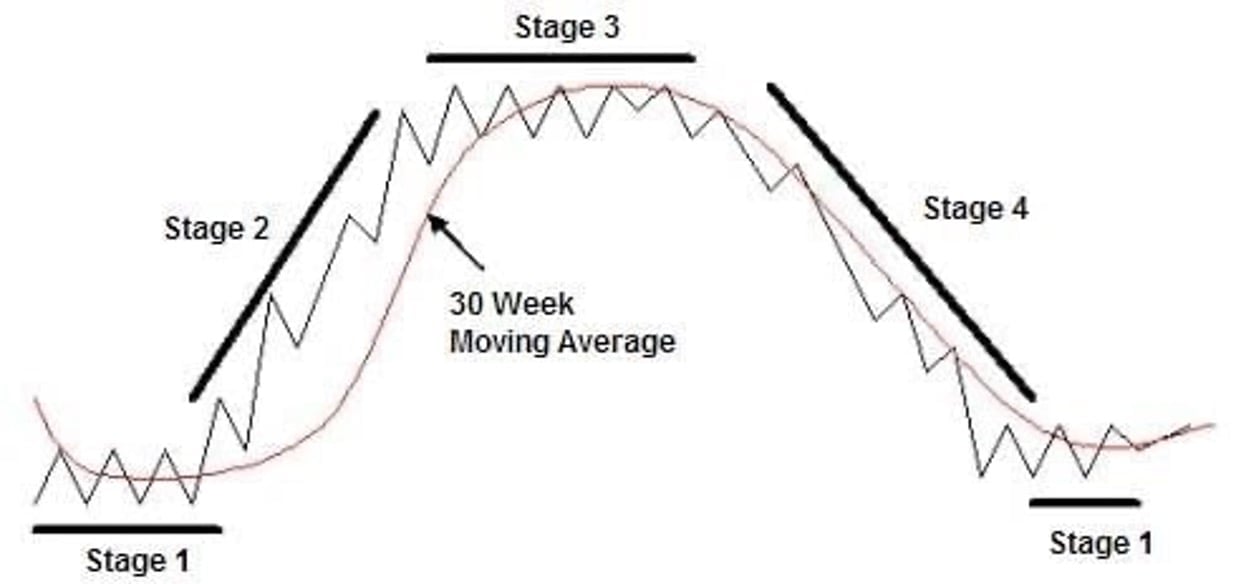
Obviously, the key to scoring consistently big returns in the market is to find stocks on the cusp of entering Stage 2 – or stocks that are about to break out.
This is exactly what Luke and his team did.They created a computer system programmed to find stocks on the cusp of entering a Stage 2 “break out.”The model scans the entire U.S. stock market every single week, checks every stock against a set of parameters consistent with a Stage-2 breakout, and returns the stocks that fit the profile.
How did Luke see Poseida last November through this “Stage Analysis” lens?
In the November 29, 2022, issue of Breakout Trader, Luke recommended a Poseida trade. The issue included Poseida’s chart with its various “stages” superimposed.I’ve recreated it below.
Here’s Luke from that issue:
Poseida traded sideways in 2021 until the fall, when it began a Stage-4 decline.You can see this represented by the first horizontal yellow channel lines followed by the descending red channel lines.This past summer, Poseida bottomed and went through a brief Stage-1 consolidation phase before it began climbing (the second yellow horizontal channel).The massive spike you see at the beginning of August reflects Poseida’s announcement of a $6 billion partnership with Roche to develop allogeneic CAR-T therapies.After that spike, the market needed to digest the exaggerated gains, which it did – but the stock found support at the bottom of its new Stage-2 breakout channel and has been marching higher ever since.You can see this in the green ascending channel lines.
Luke’s analysis went on to include PSTX’s relative strength index reading, the slope of its 50-day, 100-day, and 200-day moving averages, the strength of the Stage-2 support line which had been tested and held several times, and finally, the trade’s overall reward/risk profile.Here’s how he summed up the PSTX recommendation:
Based on its Stage-2 breakout channel, we have a reward-to-risk ratio of nearly 5-to-1. That alone is enticing.But if lightning strikes with its various treatments, the upside potential is off the charts…Let’s take our position.
So, how has this trade played out?
Well, it’s still live.But below is PSTX’s updated chart.
As I write Wednesday morning, the stock is up 78.9% since November 29th, the day of Luke’s recommendation.Over that same approximate eight-week period, the S&P is down 0.10%.Luke’s comment from earlier rings true – “there’s always a bull market somewhere. You just have to find it.”Now, yes, we’re proud of Luke’s ability to deliver this type of return for his subscribers. But we’re more interested in illustrating the power of a Stage Analysis approach.With that in mind, let’s now pivot and look at a live, potential trade in the making.
Are we watching a transition from Stage-1 to Stage-2 right now?
Below, let’s look at a new chart.We’re going to keep the name of this asset hidden for a moment. Just focus on the chart action itself.What do you see?
Let’s now look at this through a Stage Analysis lens.To be clear, some chart patterns are easier to “see” than others. In other words, you can debate where certain stages end/begin. It’s part “art,” part “science.”
But here’s a reasonable approximation of this asset’s respective stages.
We see a Stage-2 decline, identified by the red descending trendlines. That’s followed by a sideways Stage-1 consolidation, in yellow.As you can see, the asset has been exploding north here in 2023.However – technically – according to the Stage Analysis channel lines we’ve drawn, we’re still within our Stage-1 consolidation area. So, this would not yet be considered a Stage-2 breakout.Stage-2 would trigger when the price pushes north through the upper resistance level of the horizonal Stage-1 basing pattern.To be clear, that doesn’t always happen. This asset could reach its resistance level, fail to muster the strength to break through it, then fall back and continue channeling sideways in Stage 1.To throw in another wrinkle, for this to be a real Stage-2 breakout, not only would the price need to push north through resistance, it would need to happen on exaggerated volume. To a Stage Analysis trader, outsized volume is critical – it’s the rocket fuel that drives a trade.
So, what asset are we looking at?
Bitcoin.Now, you likely had some sort of reaction at that reveal.
“Oh, forget it then!”
Or…
“Hmmm, interesting.”
And that points toward a feature of Stage Analysis trading that I find fascinating…It doesn’t matter what the asset is… it doesn’t matter why the asset is breaking out… the only detail of significance is the price action, and whether it’s signifying a Stage-2 breakout trade.We made the following point in a recent Digest:
Imagine that Stock A was losing customers, losing market share, and hemorrhaging cash – yet its stock price was surging higher.Would you prefer to stay on the sidelines because you know that Stock A has all of these fundamental warts associated with it?Or would you prefer to jump into the trade based purely on its surging price, and ride the momentum higher for as long as it runs? Even though there’s no great reason why the stock is surging.At the end of the day, the only thing that matters when it comes to wealth creation is the market price – and whether your exit price is higher than your entry price.
Let’s make this specific to crypto.Are you a bitcoin skeptic?Fine if so.But as you question bitcoin as a long-term investment, what if you could see it as a shorter-term trading tool?What if a Stage Analysis lens enabled you to view bitcoin (and any investment, for that matter) as simply a means of making money – assuming its pricing strength showed certain bullish characteristics?Well, that would force a question…Would you prefer to be correct in your analysis of bitcoin’s fundamental value and ignore it? Or would you prefer to make a profitable trade?
To be clear, I’m not suggesting that bitcoin has officially entered a Stage-2 breakout and is poised to enjoy a monster bull run
In fact, in the near-term, our bet is on “down” rather than “up” based on bitcoin’s nosebleed relative strength index (RSI) reading (it’s severely overbought).However, the chart action suggests we’re nearing the top of the Stage-1 consolidation area. This means a Stage Analysis trader should be paying closer attention.The resistance level of bitcoin’s Stage-1 consolidation channel is roughly $24,400. A push north through that on heavy volume (at least 3X the norm) would suggest bitcoin has, indeed, entered a new phase – a Stage-2 breakout.Bottom line: Whether you love bitcoin or hate it, this is a real-time “choose your own adventure” trade set-up.We’ll keep tracking this in the coming weeks and will let you know how it turns out.In the meantime, to learn more about Stage Analysis trading and Luke’s Breakout Trader service, click here. I’m told that today, he’s recommending two new trades that are breaking into Stage-2.Have a good evening,Jeff Remsburg