PCE inflation comes in as expected … what does that mean for the market? … why a short-term correction needs to be on your radar … the long-term charts look bullish
This morning’s Personal Consumption Expenditures (PCE) price index report came in as expected, rising 0.3% in January and 2.4% year-over-year.
When we strip out volatile food and energy prices (giving us “core” PCE inflation), which the Federal Reserve prefers, the monthly and yearly increases were 0.4% and 2.8%, respectively.
Here are some details of the report from CNBC:
Services prices increased 0.6% on the month while goods fell 0.2%; on a 12-month basis, services rose 3.9% and goods were down 0.5%.
Within those categories, food prices accelerated 0.5%, offset by a 1.4% slide in energy. On a year-over-year basis, food was up 1.4% while energy fell 4.9%.
Wall Street is breathing a sigh of relief.
Two weeks ago, hotter than expected CPI data sent the market into a meltdown. That’s not the case with today’s numbers. While the data don’t give the Fed any major reason to accelerate its timing on rate cuts, neither do they suggest the Fed needs to slow down its timing.
As I write Thursday early-afternoon, the market is reacting favorably to the news. While the Dow is flat, the S&P and the Nasdaq are both in the green. And if we look at the CME Group’s FedWatch Tool, there’s no significant recalibration of expectations for rate cuts – both for their timing and how many 2024 could bring.
Stepping back, will this inflation reading give the market a green light to continue setting new highs?
Not necessarily. While today’s data mean the market has sidestepped a potential tripwire, there are other short-term headwinds facing stocks. But beyond these headwinds, a technical analysis of the S&P reveals there are reasons for bullishness – and more new highs.
So, if you’re in a rush, let’s jump to our takeaway…
Prepare yourself for some short-term portfolio bruises, but a wide-lens perspective suggests the market has just begun a major leg higher so don’t be shaken out of your high-quality assets.
We’ll make the case for this forecast using a Stage Analysis trading lens
This is the market approach that one of our trading experts, Luke Lango, uses in his trading services AI Trader and High Velocity Stocks.
If you’re new to the Digest and aren’t familiar with stage analysis, the idea is simple: every stock, at any given point in time, is either going up, down, or sideways.
To that end, every stock is always in one of four unique stages: 1) going sideways at a bottom, 2) going up, 3) going sideways at a top, or 4) going down.
Stage analysis is the science behind figuring out which of these four stages a stock is in at any given point in time and investing accordingly.
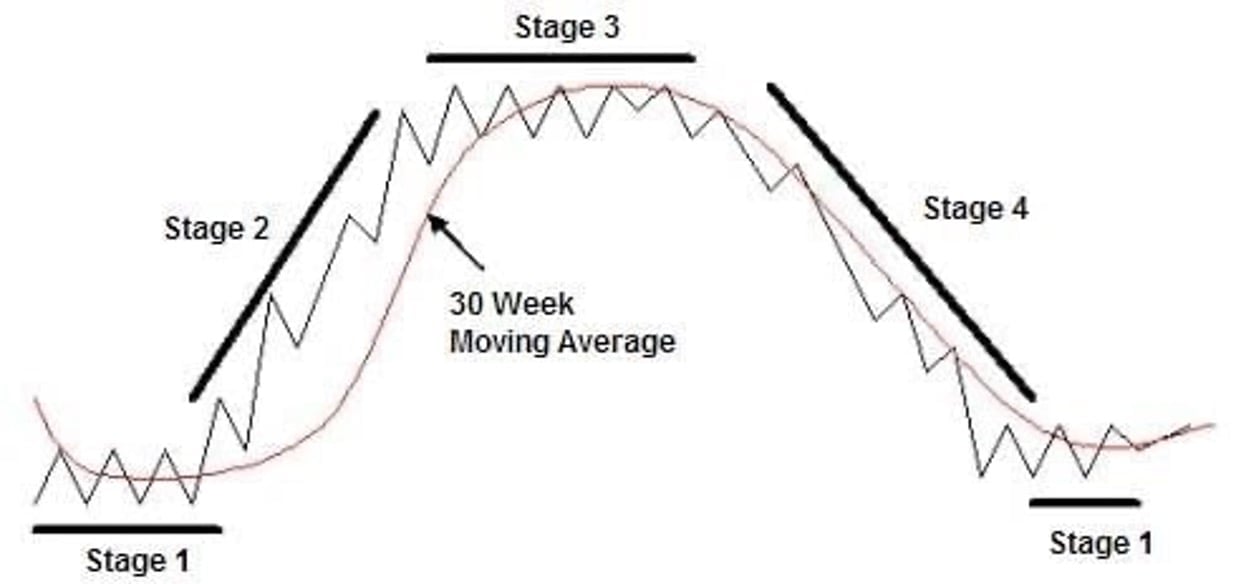
The key to scoring big returns consistently is to find stocks on the cusp of entering Stage 2, or stocks that are already breaking out in an obvious Stage-2 channel.
Meanwhile, the key to avoiding big losses is to ruthlessly eliminate stocks in your portfolio that are in Stage 4, or appear to be breaking down, about to enter Stage 4.
Where the S&P finds itself today
The S&P has been in a Stage-2 breakout since fall of 2022. But even in breakouts, there are cyclical ups and downs.
As you can see below, the S&P currently trades at the top of its breakout channel – we call this “resistance.”
Every time the S&P has climbed to resistance during this breakout, it has pulled back. Sure, we could break trend this time, but that shouldn’t be our presumption.

The first drawdown after hitting resistance was about 7%. The second registered roughly 8%. And the third was the largest, with the S&P correcting almost 11%.
Clearly, these pullbacks can rattle some investors, so it’s critical that we’re emotionally prepared for what could be coming. A basic average of these drawdowns suggests we shouldn’t be surprised by an 8% or 9% correction.
Two more technical reasons to brace yourself
In Luke’s trading services, he regularly references two technical indicators: the Relative Strength Index (RSI) and the Moving Average Convergence/Divergence (MACD) indicator.
For newer Digest readers, the RSI is a momentum indicator that measures the extent to which an asset is overbought or oversold. A reading over 70 suggests an asset is “overbought” (and likely poised to pull back as traders take profits) while a reading below 30 means it’s “oversold” (and poised for gains as bargain-hunters step in and buy).
Meanwhile, the MACD indicator reflects changes in a price trend’s strength, direction, momentum, and duration. Traders use this tool by analyzing the location of the MACD line relative to its signal line.
At its most basic interpretation, if the MACD crosses above the signal line, it’s considered a bullish crossover, and potentially a buy signal. The opposite is true as well.
Consideration is also given to whether the MACD and signal line are trading above or below the zero line. The farther the MACD and signal line are from zero, the more stretched prices are in that direction.
The most common way that traders use these indicators is by assessing overbought/oversold conditions
But there’s another fantastic way to use them – as a direction-change predictor.
When there’s a divergence between the direction of the RSI and/or MACD and the price of the underlying asset, take note. Many times, this is evidence of an impending change in the direction of the asset.
If the RSI and MACD are falling while the asset’s price is rising, that can be dangerous. It often reflects a weakening of the bullish price trend, suggesting a reversal is on the way.
To illustrate, here’s the S&P between summer 2021 and the early-2022. There are two occasions during with the RSI/MACD begin falling while the S&P keeps rising. Both divergences resulted in the S&P correcting.
With this context, what’s happening today?
As you can see below, the S&P’s RSI and MACD indicators have been trending lower since mid-December, even as the S&P’s price has raced higher.
History suggests we’d be wise to mentally prepare for a price correction.
But our analysis can’t end there
Stock charts can tell us very different things when we vary the scale.
We’ve just detailed why “bearish” is our short-term technical takeaway. But when we expand our timeframe, what does that tell us?
Returning to stage analysis, let’s look at the S&P over the last eight years.
A moment ago, we suggested that we’ve been in a Stage-2 breakout since fall of 2022. But what if that wasn’t the case?
What if we’ve actually been trading sideways in a co-Stage-4/Stage-3 hybrid since January 2022, and we’ve only just broken out of it here in 2024, reasserting Stage 2?
As you can see below, that would mean the recent upswing in the market is just part of Stage 3 volatility. The real Stage-2 gains have barely begun (circled in green).
To be clear, this doesn’t mean we’ll avoid that potential 8%/9% correction. But it does suggest that once it’s behind us, the bigger, multi-quarter move is bullish, not bearish.
One caveat…
The level of 4,800 is the S&P’s former resistance point (about 5.5% below us as I write). If we get a correction, we’ll be watching this level closely and hoping it holds. Any time former resistance turns into new support, it’s very bullish.
On the other hand, if the S&P fails to hold 4,800, that would weaken the argument that we’ve just broken out into a new, large-scale Stage-2 phase. It would suggest a continuation of consolidation for the time-being.
Clearly, 4,800 is an important level. We’ll keep you updated.
Before we sign off, two quick words of “congratulations” to Luke’s subscribers
The first congrats goes to Luke’s High Velocity Stocks subscribers. In this trading service, Luke applies today’s stage analysis framework to the biotech space. The sector is highly volatile, which can cut both ways for investors. Fortunately, right now, it’s cutting in favor of bullish traders.
I’m looking at Luke’s open trading portfolio. Each one of the 10 positions is showing gains, and three of them are up more than 100%.
Ardelyx is up 146% since last August. ADCT Therapeutics is up 153% in less than two months (Luke recommended it on January 9th). And Applied Therapeutics is up 160% in even less time – it was Luke’s pick back on January 23rd.
This is the power of a stage analysis framework meeting an explosive sector.
Here’s what Luke wrote about it at the beginning of the month:
We’re in the midst of a 2024 Biotech Boom.
And since rates should keep moving lower, we think this boom will last all year.
The market tides continue to turn in favor of biotech stocks as investors grow increasingly confident in a soft landing for the U.S. economy in 2024 and risk sentiments are meaningfully improving.
Biotech stocks will keep surging. And we will keep raking in the profits by buying the best breakouts in biotech.
That’s exactly what’s happened. So, a big congrats to High Velocity Stocks subscribers. If you want to log in to check the portfolio, click here.
The second “congratulations” goes to Luke’s Ultimate Crypto subscribers
If you haven’t been watching, the entire crypto sector is exploding right now, and Bitcoin is flirting with its all-time high. The grandaddy crypto is up 48% in February alone.
A handful of leading altcoins are surging alongside Bitcoin, some racing even higher. For example, one of Luke’s holdings in Ultimate Crypto, Celo, is up 69% here in February.
But as we noted in yesterday’s Digest, Luke believes this is just the beginning of a multi-month push that will gives investors the chance to 10X their money over the next 12 months.
If you’re skeptical of that type of return, I’ll point out that Luke’s Ultimate Crypto portfolio currently holds one position that’s up 1,776%, and a second that’s up 2,268%.
We’re running long today, but for more of Luke’s research on this crypto surge, click here. In any case, a big congratulations to Ultimate Crypto subscribers for what appears to be the beginnings of some serious gains.
We’ll keep you updated.
Have a good evening,
Jeff Remsburg