A new tailwind from the 10-year Treasury yield … Luke Lango’s prediction … what the S&P’s RSI and MACD are telling us … Louis Navellier’s warning about AI stocks
The market is back to all-time highs, and from the looks of it, we’re headed even higher.
To understand why, let’s begin with the 10-year Treasury yield. As regular Digest readers know, this is the single most important number for the global economy and investment markets.
From our Tuesday Digest:
…the more immediate influence on your portfolio will be which way the 10-year Treasury yield breaks.
Below you can see how the 10-year Treasury yield has fallen to its up-trending support line.

If support holds, resulting in a bounce that sends yields higher into this trading channel, it will create a fresh headwind against stock gains. But if this support level breaks, it’s likely to fuel a new leg higher for the market.
In the wake of yesterday’s CPI report, the 10-year Treasury yield fell to 4.36%, breaking its support line as you can see below.
Let’s jump to our hypergrowth expert, Luke Lango. From Luke’s Daily Notes yesterday in Innovation Investor:
We’ve been saying – ever since stocks started falling in April – that the market would stage a furious pre-summer rally on the back of softening inflation trends and rising rate-cut hopes.
That pre-summer rally is now in full swing…
To be sure, things look a bit technically “toppy” at the current moment. The S&P 500 is nearly 4% above its 20-day moving average, the Relative Strength Index is just a hair below 70, and the Moving Average Convergence Divergence line is far above the Signal Line.
Therefore, we wouldn’t be surprised if the market as a whole is approaching a short-term top.
But after a brief pullback, stocks will likely resume their upward march.
Let’s piggyback on Luke’s analysis, looking at the S&P’s technical set-up. Remember, after falling 5.5% between late-March and mid-April, the S&P has now rallied roughly 7% in its surge back to an all-time high.
Meanwhile, as I write, the Dow is pushing through 40,000 for the first time ever.
These moves require significant buying energy. So, to Luke’s point, we should investigate…
Is this climb nearing exhaustion or does it still have legs?
To help answer this, let’s look at the S&P’s RSI and MACD
For newer Digest readers, the Relative Strength Index (RSI) is a momentum indicator that measures the extent to which an asset is overbought or oversold.
A reading over 70 suggests an asset is “overbought” (and likely poised to pull back as traders take profits) while a reading below 30 means it’s “oversold” (and poised for gains as bargain-hunters step in and buy).
Below, we look at the S&P’s RSI. There are two things to notice.
First, we’re just below the overbought line-in-the-sand level of 70. That’s a nod toward the “toppy” description Luke provided a moment ago.
However, look at the S&P’s price action over the last few months. Even after reaching overbought levels, the S&P has shown that it’s quite capable of climbing even higher (circled in dotted green).
We’ll sum this up as “toppy, but not demanding a pullback.”
We come to a similar conclusion after analyzing the MACD
The Moving Average Convergence/Divergence (MACD) indicator reflects changes in a price trend’s strength, direction, momentum and duration. Traders use this tool by analyzing the location of the MACD line relative to its signal line.
At its most basic interpretation, if the MACD crosses above the signal line, it’s considered a bullish crossover, and potentially a buy signal. The opposite is true as well.
Consideration is also given to whether the MACD and signal line are trading above or below the zero line. The farther the MACD and signal line are from zero, the more stretched prices are in that direction.
Below, you can see how a bullish crossover from the beginning of the month is powering this move.
Also, notice Luke’s point: the MACD line (in black) is far above its signal line (in red).
While this does suggest the S&P is a little stretched, you’ll see that the overall MACD level remains well beneath its highest levels from earlier this year.
Things are a bit topsy right now. Don’t be surprised if we get a little pullback over the next few days.
If we do, buy that dip with confidence. Stocks will shoot higher into July. Let’s make as much as possible in this rally!
But with stocks at all-time highs, do we need to be more cautious?
This used to be my concern.
The fear was: “We’re in thin air up here. It feels like heightened risk for a big pullback.” But a study of market history tells us such a fear usually isn’t warranted.
William O’Neil, who founded Investor’s Business Daily and created the very popular swing-trading system known as CANSLIM, had a quote about this:
It is one of the great paradoxes of the stock market that what seems too high usually goes higher and what seems too low usually goes lower.
My friend Meb Faber, the CEO of Cambria Investments, is a widely respected quant analyst. Here’s his take:
Is buying stocks at an all-time high a good idea?
No, it’s not a good idea, which should surprise no one.
The fact that it is a GREAT idea, well, that should surprise everyone.
Meb detailed the results of a back-test he ran that had two rules: remain in stocks if they’re trading at all-time highs at the end of the month. If they’re not at all-time highs, then move into to government bonds.
Here’s the conclusion:
It turns out, it’s a pretty damn good strategy. Better returns than just stocks, lower volatility, and WAY lower drawdowns…
It’s an acknowledgement that all-time highs are nothing to be afraid of.
Put it altogether and we echo Luke’s takeaway: Though we might be in for some short-term consolidation and/or profit-taking, a wider analysis suggests more gains as we move into summer.
Now, this isn’t a green light to buy everything – in fact, legendary investor Louis Navellier just sounded an alarm that surprised me
Louis is one of the early pioneers of using predictive algorithms to scour the markets for quantitatively strong stocks. Forbes even named him the “King of Quants.”
As a quantitative investor, he has strict investment rules that are rooted in cold, impartial numbers. When these rules trigger a buy, he buys. When they trigger a sell, he sells. It’s a complex system to build, but a pretty simple one to trade by.
Louis’ quant system moved his subscribers into top-tier AI-related stocks. For example, Louis’ algorithms flagged Nvidia in 2019, which resulted in his Growth Investor subscribers being up 2,143% as I write Thursday morning.
But Louis recently warned investors to be careful about froth he’s seeing in the AI sector:
The fact of the matter is NVIDIA dominates the AI industry, so it’s no surprise that it continues to boast stunning fundamentals (and clearly has the best fundamentals out of all the Magnificent Seven stocks). And thanks to those fundamentals, I am confident that NVIDIA will one day become a $1,000 stock as AI continues to innovate and the AI industry grows.
However, given the hype surrounding AI, I am also deeply worried that folks are falling into the same trap they fell into during the dot-com boom of the 1990s.
Back in the 1990s, Wall Street and the mainstream media pushed the idea that the Internet was such a game-changing technology that the old rules about valuing stocks had to be thrown out the window.
We’re seeing the same situation play out with AI.
So, I predict that the speculative frenzy around AI is going to come crashing down just like every frenzy before it. And when that crash happens… folks invested in the wrong AI stocks will be left holding the bag.
As always, Louis’ dividing line for stocks – in this case, AI stocks – is fundamental strength
If you want help separating the AI companies that are fundamentally strong from the hype-based AI imposters Louis is concerned about, I’ll point you toward his free Portfolio Grader tool.
Louis has codified much of his proprietary quant-based market system, and now offers it to the investment community through his Portfolio Grader.
Think of it as a diagnostic that gives you an instant snapshot of a stock’s financial strength. It focuses the same eight metrics that drive Louis’ stock selection process for all his premium investment services.
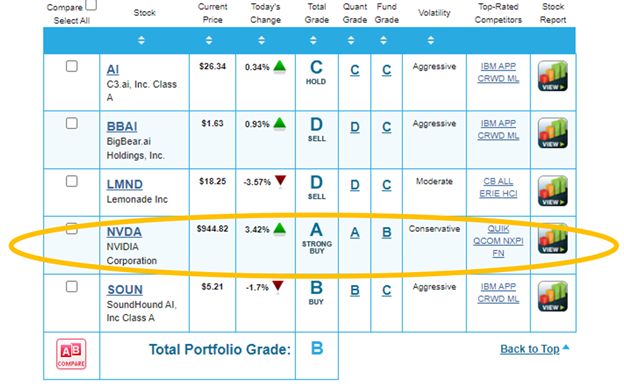
To illustrate, we’ll compare Nvidia to a few popular, smaller-cap AI plays: C3.ai, BigBear.ai, SoundHound AI, and Lemonade.
If you’re looking to invest in just one of these stocks, Louis’ Portfolio Grader makes your decision pretty easy…
If you’d like even more of Louis’ help in avoiding the AI stocks most likely to hurt your portfolio, he’s put together a research video.
From Louis:
I’m issuing an urgent warning about the AI “losers,” that won’t survive – and how you can find the AI trophy stocks (like NVIDIA) that can become the cornerstone of your portfolio for the next decade.
Go here to learn more about my shocking bearish AI prediction right now.
Wrapping up
It looks like after a brief pullback, this market is going to run, so let’s not fight it.
Mind your stop-losses and position sizes in case we’re thrown any curveballs, but until market’s big-picture direction changes, the trend is our friend.
Just be careful about your AI plays. If Louis is right, lots of investors will end up getting burned.
Have a good evening,
Jeff Remsburg