
Palantir Technologies’ (NYSE:PLTR) investors can breathe a sigh of relief. The company posted strong second-quarter 2024 results. With that in the rear-view mirror, it’s a great time to apply Palantir technical analysis and see what the charts are telling us. Overall, it looks like the Palantir stock buyers are on the winning side of the trade.
Just to recap, Palantir Technologies is a well-known provider of security products and services. The company generated Q2-2024 revenue of $678 million and earnings of 9 cents per share, beating the analysts’ consensus call for revenue of $653 million and earnings of 8 cents per share.
Hence, there’s no need to worry about an earnings disaster at this point. Now, we can check the charts and look for trends to indicate the possible future trajectory of Palantir stock.
Palantir Stock: Getting Bought, but Not Overbought
Sometimes, the Palantir Technologies bulls are in control; other times, the bears are in the driver’s seat. This can be confusing and frustrating, but technical indicators such as the Relative Strength Index or RSI can help us see the big picture.
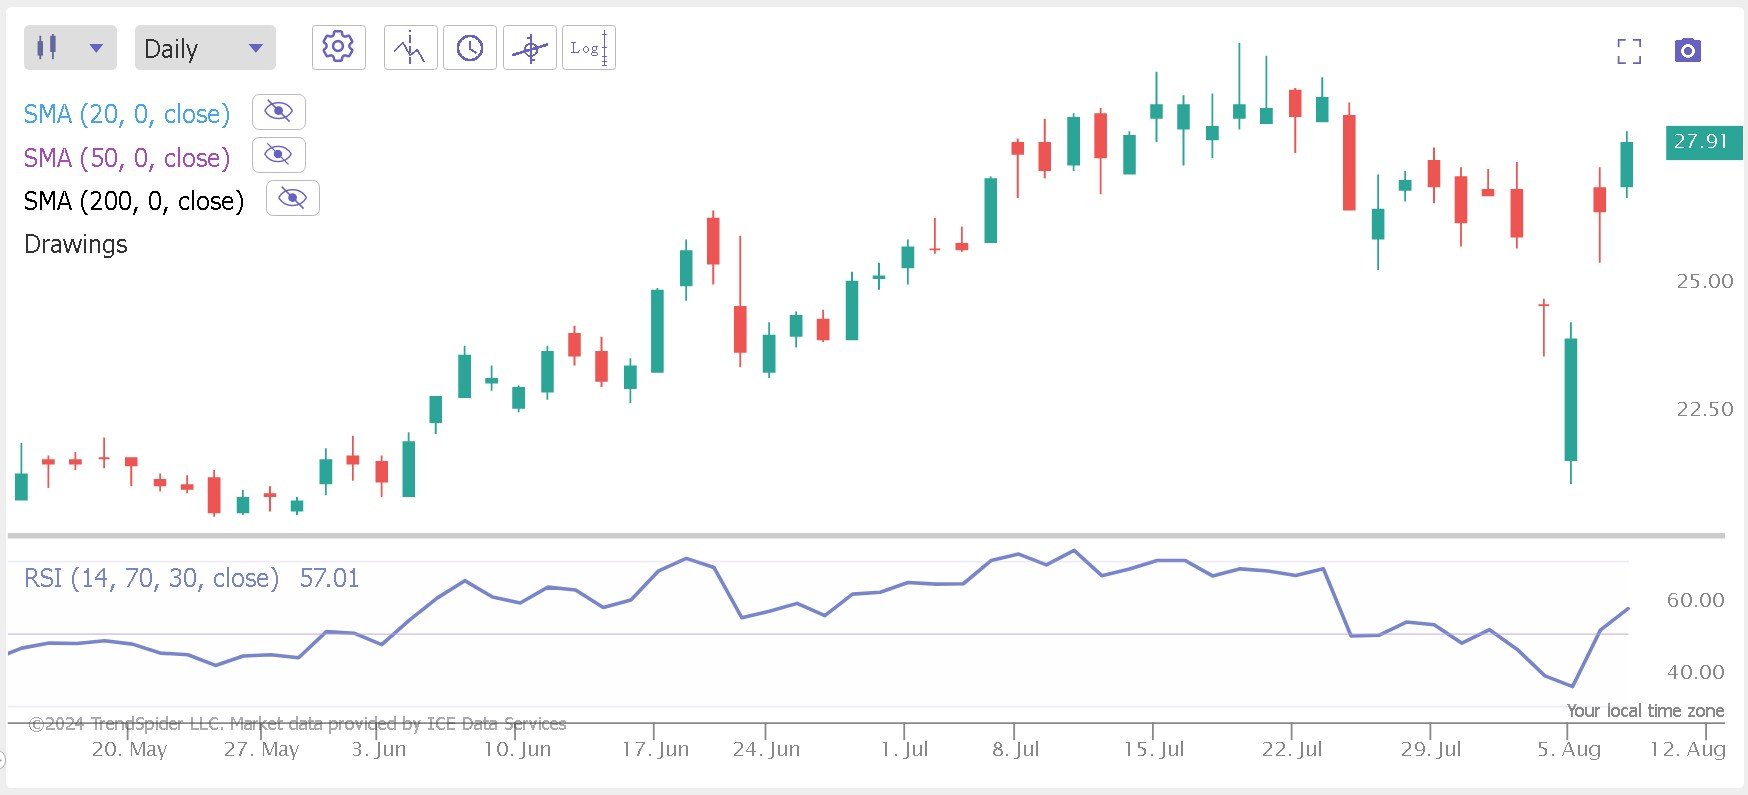
This daily candlestick chart of Palantir stock has the RSI indicator at the bottom. It’s a trend/directional indicator, and the blue RSI line is pointing up. That’s a sign that the buyers have regained control of the price action.
At the same time, the RSI hasn’t gone above 70, which would indicate that the stock is overbought and vulnerable to a pullback. As of this writing, the RSI for Palantir stock is around 57, so there’s still room for the bulls to run.
Just be sure to keep an eye on the RSI indicator during the coming days. After all, you won’t want to hold on to any stock position in overbought territory for too long.
That’s a Nice Bounce!
Moving averages can also help to assess whether a stock is in real trouble or not. There’s one particular moving average that I like to call the “line in the sand.” Cross below it, and trouble may be afoot.
For me, the “line in the sand” that separates trouble from non-trouble is the 200-day moving average. Here’s the Palantir stock daily candlestick chart again, but with the 200-day moving average shown as a black line.
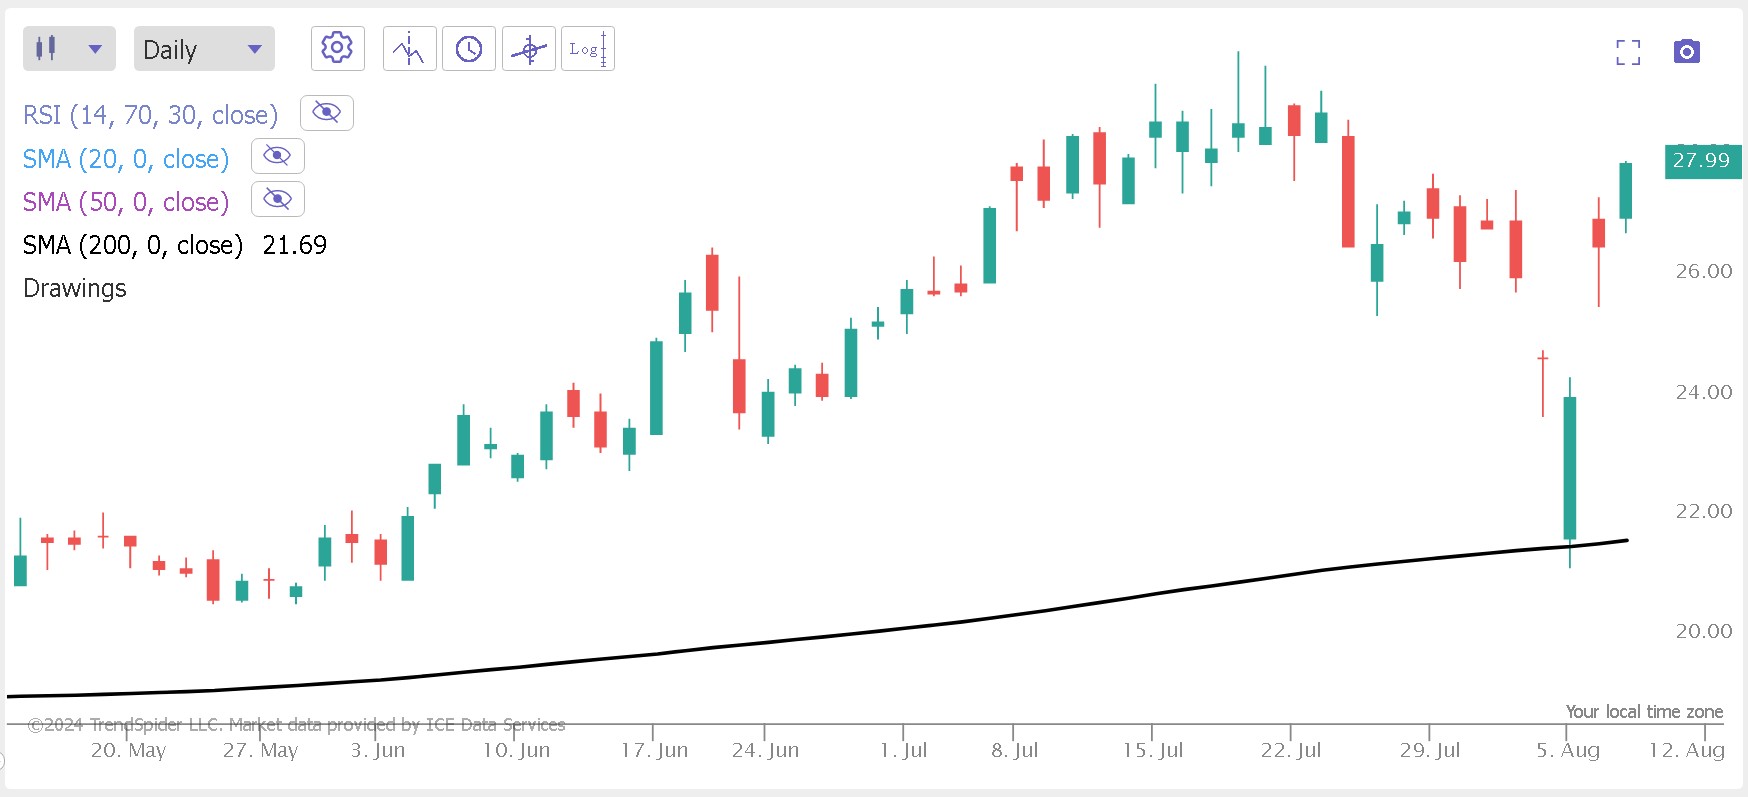
As you can see, PLTR recently bounced right off of the black line. It’s almost textbook-perfect!
This doesn’t mean Palantir stock is “out of the woods,” so to speak, since it could still turn around and fall below the 200-day moving average. So, as always, staying informed and monitoring your charts will be crucially important.
Palantir Technical Analysis: Buyers Can Win This Tug-of-War
Palantir Technologies released its long-awaited quarterly results and exceeded Wall Street’s expectations. Meanwhile, the lines on the charts suggest that the PLTR stock buyers are in control, at least for now.
The takeaway is that it’s safe to buy Palantir stock now as you’ll be on the right side of the trade. Don’t get too complacent, though.
Check your charts every day, and apply Palantir technical analysis indicators like the RSI and 200-day moving average. Even if you like Palantir Technologies as a company, stay alert and be ready to bail as a good trade can always turn bad.
On the date of publication, David Moadel did not have (either directly or indirectly) any positions in the securities mentioned in this article. The opinions expressed in this article are those of the writer, subject to the InvestorPlace.com Publishing Guidelines.
On the date of publication, the responsible editor did not have (either directly or indirectly) any positions in the securities mentioned in this article.