As I write Wednesday afternoon, stocks are trying to find their footing during a volatile session – swinging between gains and losses as investors weigh upbeat earnings from Bank of America and Morgan Stanley against renewed U.S.-China trade tensions.
For the most part, Wall Street has been willing to look past recent China/trade war jitters today – even though Treasury Secretary Scott Bessent said this morning that the U.S. will set price floors across various industries to combat China’s market manipulation.
From Bessent:
When you are facing a non-market economy like China, then you have to exercise industrial policy.
So we’re going to set price floors and the forward buying to make sure that this doesn’t happen again and we’re going to do it across a range of industries.
Price floors might sound friendlier than tariffs but make no mistake – they’re still a form of market intervention. China won’t like it.
For now, though, traders seem more focused on earnings tailwinds than the policy overhang. And so, the Wall Street party keeps rocking.
Now, beyond AI stocks, one asset has been drinking from the spiked punchbowl – something we’ve been recommending for years…
Gold is on pace for its best year since 1979, having surged more than 57% in 2025
But if you’re considering hopping aboard this rocket ship, you might want to wait for a more attractive entry point.
Gold’s Relative Strength Index (RSI) and Moving Average Convergence/Divergence (MACD) indicators are red hot, suggesting a coming pullback.
To make sure we’re all on the same page, the RSI is a momentum indicator measuring the extent to which an asset is overbought or oversold.
A reading over 70 suggests an asset is “overbought” (and likely poised to pull back as traders take profits) while a reading below 30 means it’s “oversold” (and poised for gains as bargain-hunters step in to buy).
Meanwhile, the MACD indicator reflects changes in a price trend’s strength, direction, momentum and duration. Traders analyze the location of the MACD line relative to its signal line, with one consideration being that the farther the MACD and signal line are from zero, the more stretched prices are in that direction.
Below, we look at gold’s price along with its RSI and MACD over the last year. Here are the first two things to notice:
- The RSI is at 82, deep in “overbought” territory
- The MACD is blown out to the top. Though you can’t see it on this scale, the MACD currently trades at the highest level of all time, according to our charting tool StockCharts.com
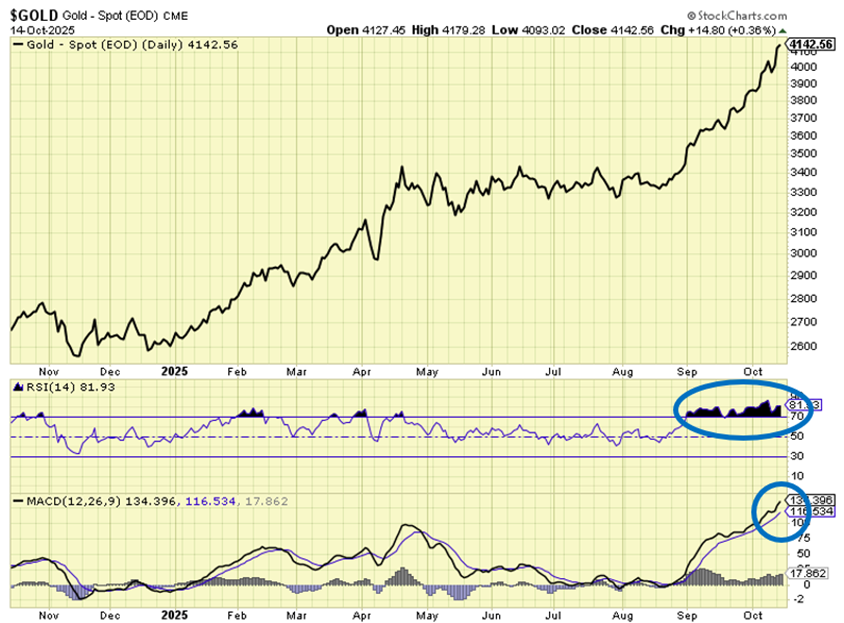
Now, a goldbug might respond, “Jeff, your own chart refutes your point. Gold has had an overbought RSI since September 1 and yet, in the ensuing weeks, has climbed almost 20%.”
That’s true. But expecting gold to continue rising under these conditions is a bit like sitting at a blackjack table in Vegas, holding 18 in your hand, and asking the dealer for another card.
Could you be handed a three and hit blackjack?
Sure! But it’s more likely you’ll get a card higher than three and bust.
That doesn’t mean a massive price pullback
What’s more likely is something within 4%-5% or so, along with a period of sideways price action that gives the recent surge time to digest. Legendary investor Louis Navellier calls it a “back and fill.”
To get a sense for what gold has done in the wake of recent overbought RSI readings, below, we look at the yellow metal’s price in 2025. We highlight each time the RSI went overbought and how the price moved until the RSI’s ensuing lowest point.
Here’s what to look for:
- February: +9%
- Mid-March: -0.8%
- Late-March: -3.3%
- April: -2.9%
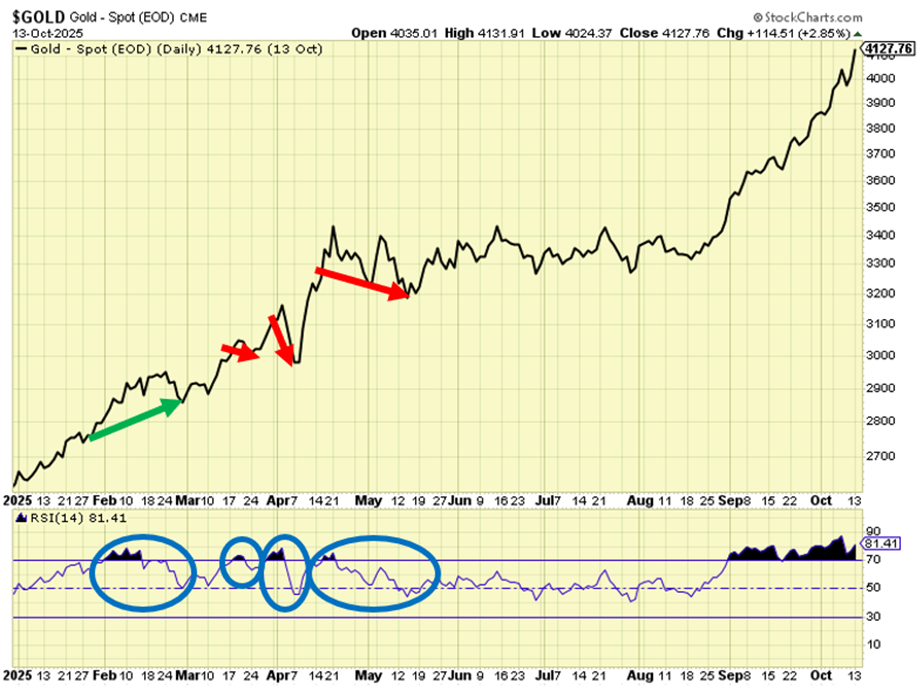
Given how overbought gold is today, we think the pullback will come in stronger than these examples. So, don’t be surprised if gold retreats below $4,000 for a stretch.
So, in the short term, our money is on “flat to down” for gold’s price. But longer term, we remain ardent gold bulls for many reasons, including:
- Interest rate cuts from the Fed, which lowers the opportunity cost of holding non-yielding assets
- Rising safe-haven demand amid renewed U.S.-China tensions and global geopolitical uncertainty
- The weak U.S. dollar
- Persistent inflation risks and fiscal pressures (rising debt, deficits) that suggest more long-term dollar debasement
- Global central banks’ aggressive accumulation of gold in their reserves
Speaking of Louis and gold, he’s so bullish that he just added his 10th gold play to his Accelerated Profits portfolio.
From Louis:
The fact is that gold is sitting at record-high prices, and that’s opened the door to a lot of exciting investment opportunities.
Speaking of which, I have a new stock to add to the Buy List [yesterday].
Now, because it’s Louis, this new gold play has fundamental tailwinds driving it forward.
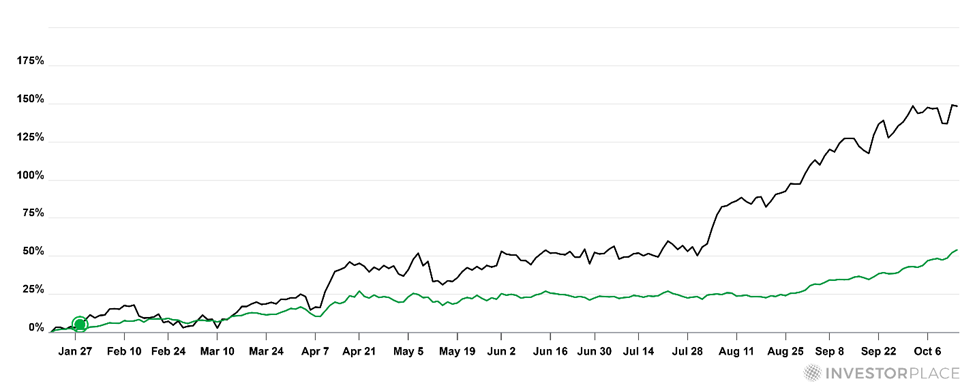
For an example of what this can do for performance, let’s spotlight Louis’ gold pick from January 28 – Kinross Gold (KGC).
While gold has climbed 51% since, KGC has surged 154%.
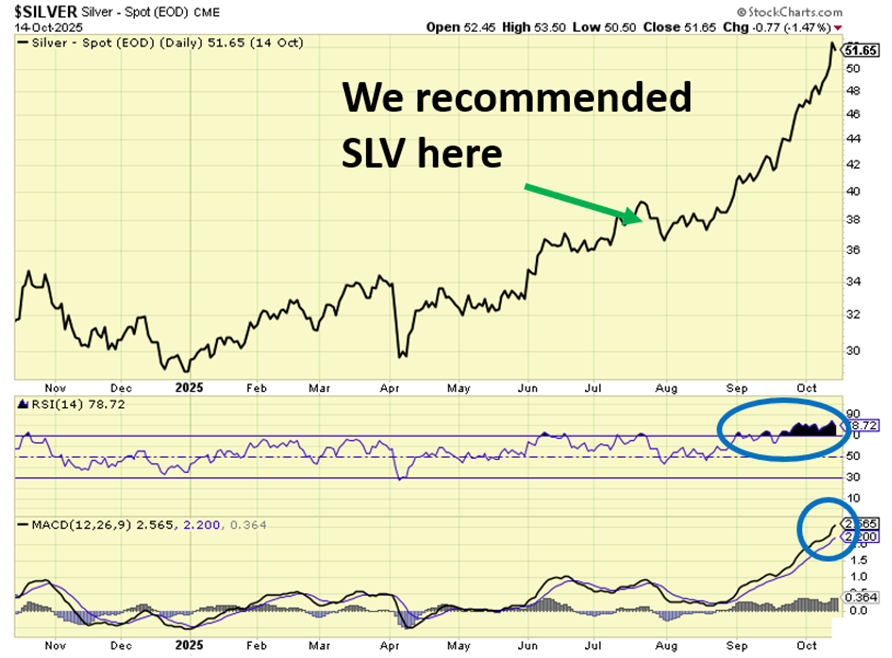
And while you’re at it, don’t forget silver
Silver futures are hitting an all-time high this morning, taking out the 45-year-old record set when the Hunt brothers attempted to corner the silver market.
If you acted on our June 17 Digest in which we profiled the metal and recommended SLV, the iShares Silver Trust, congrats, you’re up 42% and counting.
Silver is now in the same position as gold today – long-term tailwinds, short-term technical headwinds.
As you can see below, silver’s RSI clocks in at 79. Meanwhile, its MACD trades at the second-highest level of the decade, trailing only levels hit during the Covid flight to safety.
Looking beyond a potential short-term pullback, silver has plenty of room to run
One reason is supply constraints.
According to the Silver Institute, global silver markets ran a deficit of roughly 117 million ounces in 2024 – the fifth straight year of undersupply. Most silver is produced as a by-product of mining other metals such as copper and zinc, so higher prices won’t necessarily lead to more supply anytime soon.
Then there’s the industrial side.
Silver plays a critical role in solar panel production, which continues to grow rapidly. Tiny amounts of silver paste are used to form the conductive lines that carry electricity generated from sunlight in photovoltaic (PV) cells. Each panel contains roughly 15–20 grams of silver, and as solar capacity expands worldwide, that adds up to enormous demand.
Finally, silver is one of the most overlooked heroes in the AI story.
It’s not just a precious metal; it’s the best natural conductor of electricity. That makes it indispensable in the wiring, switches, and contacts inside the data centers where AI models are trained, as well as in the chips that run those models.
So, the more that AI scales, the more demand there is for components that can move massive amounts of energy and data at lightning speed – and silver’s conductivity makes it irreplaceable in those applications.
On that AI note, here’s our global macro specialist, Eric Fry, of Fry’s Investment Report:
Industrial usage is surging, which the Silver Institute attributes to high-tech applications like advanced semiconductors, 5G infrastructure, EVs, sensors, and power grid components.
AI is supercharging this source of demand in many ways – think denser servers, networking hardware, high-speed interconnects, and power management in AI data centers, all of which lean on silver’s unmatched conductivity.
Eric’s recommended silver play in Investment Report, made on June 12, is up 31%. I won’t reveal it out of respect for subscribers, but as noted earlier, SLV is an option to consider if you’re looking for silver exposure.
Circling back to gold, a hat tip to Eric on his Westgold Resources (WGXRF) recommendation to Investment Report subscribers back in January. They’re up 190% already. To learn about joining Eric as a subscriber, click here.
Bottom line: Both gold and silver are crushing today. Be aware of the overbought technical conditions, but if we get a pullback, this is still a trade you want to ride.
Did you catch this morning’s Super AI Trading Event?
TradeSmith CEO Keith Kaplan unveiled his new AI-powered stock-picking system – a five-stock rotating portfolio that crushed the market in back-tests, delivering average annual gains of 374% (without leverage or options).
Last year alone, the strategy would have booked a 602% return. That’s over 30X the S&P 500 and more than triple Nvidia’s gains.
And the best part? It takes just a few minutes a week to follow.
If you missed it, you can catch a free replay – plus, one of the AI’s top stock picks – right here.
Have a good evening,
Jeff Remsburg