Bitcoin is approaching its 50-week moving average… a return of the bull, or a new crypto winter?… silver exploded as we predicted – but is gold your better horse today?… what historical data says about trading gold right now
Bitcoin is on the cusp of reaching a critical technical level – and what happens there could reignite the bull market…or trigger the next painful leg lower in a crypto winter.
Our crypto expert, Luke Lango, put this pivot point on our radar last fall.
As Bitcoin was crashing, Luke noted that his biggest concern was the loss of its 50-week moving average (MA).
From Luke:
In past cycles, this level has often marked the end of the party.
Excluding the COVID anomaly, every meaningful break-and-close below the 50-week MA with the slope rolling over has marked the end of a boom cycle.
In early November, Bitcoin fell below this critical line in the sand. But rather than continue to fall, it began churning sideways. And since Christmas week, it’s been climbing – up about 10% since then.
While we’re encouraged, the real test – the 50-week MA – is rapidly approaching, which you can see below in Bitcoin’s two-year chart.
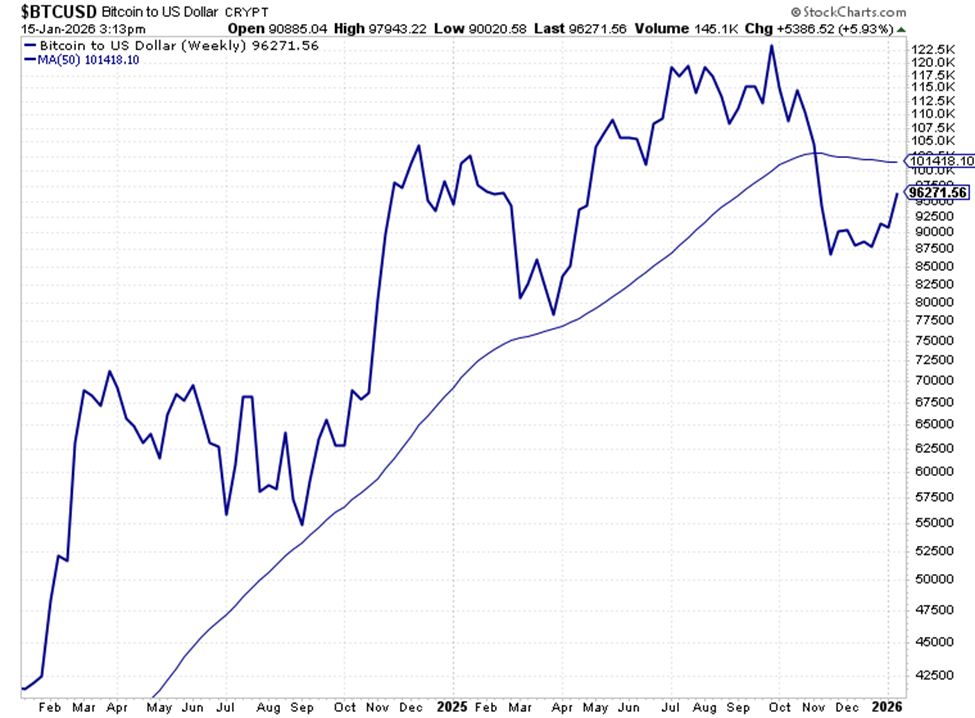
Source: StockCharts
Bitcoin’s price history offers clues about how this might play out.
Bearish: In early 2022, Bitcoin lost its 50-week MA, rallied hard to briefly touch it, only to immediately collapse – losing more than 60% into early 2023.
Bullish: In early 2023, Bitcoin rallied to test its 50-week MA, got rejected, but strengthened and soon pushed through. It then soared about 200% into spring 2024.
Below you can see these two paths.
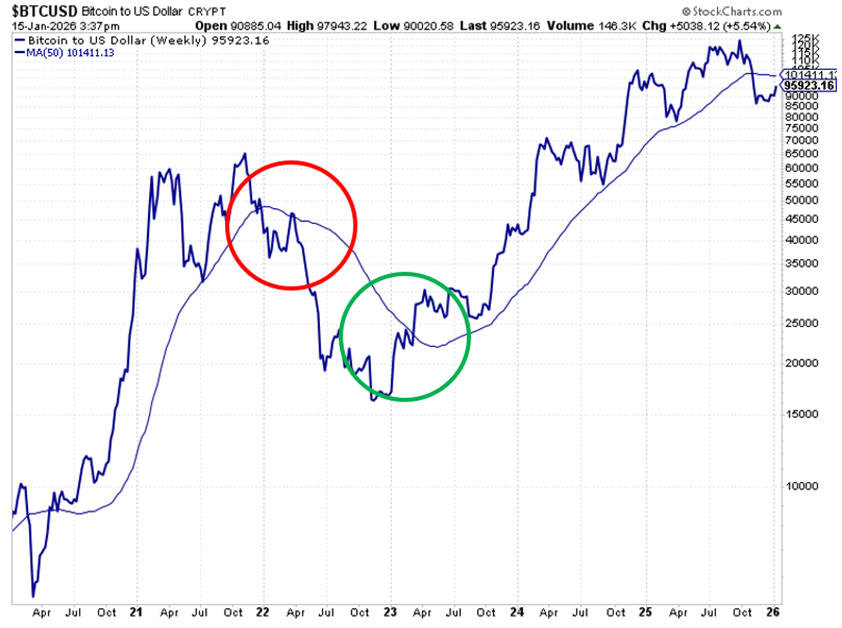
One thing should immediately jump out to you…
The bearish outcome took place on the heels of a crypto bull market, while the bullish outcome happened following a bear market.
We’re coming off a bull, which suggests a greater likelihood of the outcome crypto investors don’t want.
Could this time be different?
Sure – as we’ve pointed out in the Digest, Bitcoin is maturing from a moonshot “full risk” speculation to a heavily invested part of the mainstream financial infrastructure, supported by institutional dollars.
While that potentially limits the massive upside that Bitcoin investors enjoyed in the past, it could also cap the stomach-churning collapses.
Still, caution is our default position today.
As we eye the 50-week MA at roughly $101,500, we recall Luke’s analysis from December:
If we get rejected at the 50-week – like we did in July 2018 and March 2022 – that’ll be a very bearish signal for Bitcoin.
Those were bear-market rejections. Hard stops. Pivot points that preceded massive downturns.
But if we jump above the 50-week and sail higher – like we did in May 2020 – that’ll be a very bullish signal for Bitcoin.
That moment kicked off the most explosive bull market since 2017.
As I write on Thursday, Bitcoin has about 5% left to climb before we hit this critical level.
We’ll keep you updated.
Checking in on “analog” Bitcoin (gold) and its silver sister
Over the past year, we’ve consistently urged Digest readers to own both gold and silver. But as relative value has shifted, we’ve also been clear about which metal should lead at different points in the cycle.
Last year, when the gold-to-silver ratio stretched to extreme levels, we argued that silver was the better horse for outperformance.
But today, that ratio has collapsed. Is the leadership baton about to pass back to gold?
To unpack this, let’s revisit the gold-to-silver ratio – a long-standing measure of relative value between the two metals to see what it’s telling us now.
Simply put, this ratio tells us how many ounces of silver equal the price of one ounce of gold.
Historically, this ratio has been mean-reverting.
- In the 20th century, it averaged roughly 47:1
- From 2000 through 2020, it averaged closer to 60:1
In the first half of 2025, however, fear and a preference for gold sent the ratio above 105 – just shy of its COVID-panic peak. At that point, silver was deeply undervalued relative to gold.
But as the ratio began to roll over, we flagged silver’s asymmetric upside. In our July 25 Digest, we wrote:
We don’t anticipate a meaningful decline in gold’s price beyond normal profit-taking and healthy “two steps forward, one step back” market action.
Therefore, if the gold/silver ratio is to continue normalizing to the more recent average of around 60, it’ll be up to silver to do the heavy lifting – meaning silver’s price gains must outpace those of gold.
That’s exactly what we expect.
Sure enough, since that Digest, while gold has climbed 37%, silver has exploded 136%.
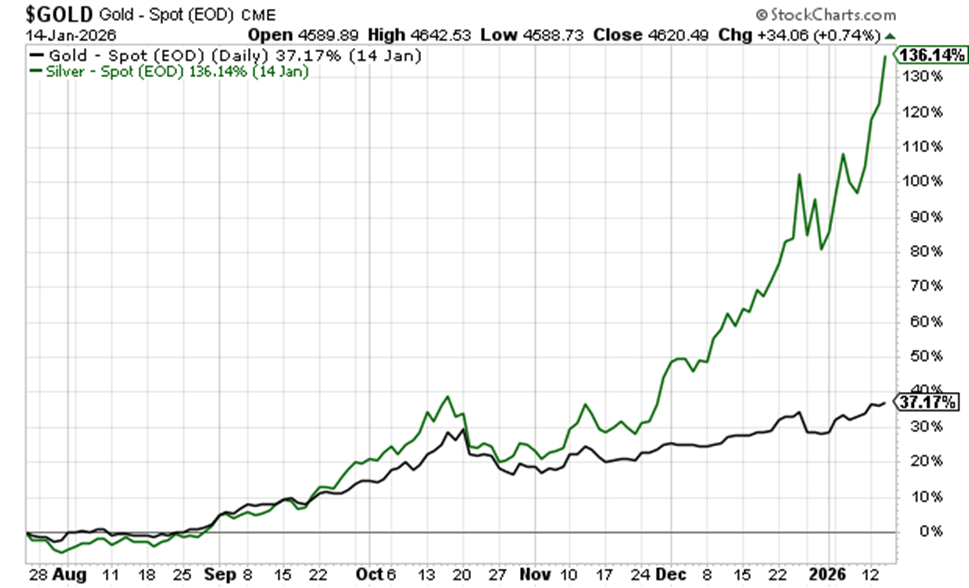
But after this blistering rally, is it time to bet on gold for outperformance?
Silver’s explosive move has dramatically reset the gold-to-silver ratio. As I write Thursday, it sits at about 51 – its lowest level since 2012. This is below the modern historical norm and even beneath the 2000–2020 average.
Practically speaking, it means silver has gone from undervalued to relatively expensive versus gold in a very short period.
Now, this doesn’t mean silver must crash. But it does suggest the easy relative gains are behind us.
From here, history argues that gold is more likely to outperform silver as the ratio works its way back toward equilibrium, which we’d peg in the mid-to-upper 50s, with 58 to 60 as a reasonable medium-term target.
Bottom line: Silver did exactly what we expected when the ratio was extreme. Now that the pendulum has swung the other way, the smarter relative bet is shifting back toward gold – even if both metals continue rising in absolute terms.
What does historical data say about a gold trade right now?
It backs us up. In short, it says that now is a good time to bank on higher gold prices.
At least that’s the takeaway from TradeSmith’s Seasonality Tool.
For newer Digest readers, TradeSmith is our corporate affiliate and one of the preeminent quant shops in the investment industry. They support more than 130,000 investors worldwide, monitoring roughly $29 billion in assets through its analytics and portfolio tools.
Their Seasonality Tool is an example of those tools: it scans thousands of securities to uncover historically reliable calendar-based patterns that can help investors better time entries and exits, even in volatile or sideways markets.
To illustrate using gold, let’s turn to the SPDR Gold Shares ETF (GLD).
As you can see below, GLD is in the middle of a highly consistent seasonal strength period running between January 8 and January 30.
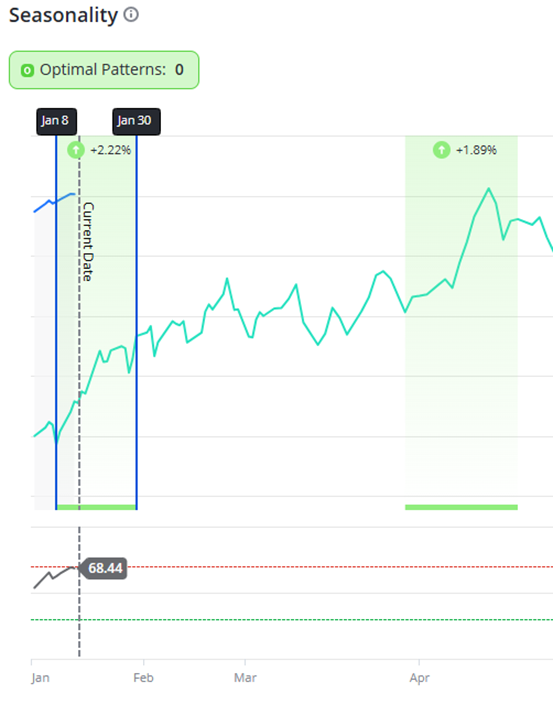
This is a tightly defined window that has repeated across market cycles, inflation regimes, and geopolitical backdrops.
Here’s how GLD has behaved historically during this January window:
- 93.33% accuracy rate
- +2.22% average return
- +1.40% median return
- +36.83% annualized return
In other words, nearly every year over the tested period, gold has moved higher during this stretch – regardless of whether the stock market was rising, falling, or chopping sideways.
This is an example of why knowing seasonal trends for your portfolio holdings matters
Gold doesn’t just respond to inflation fears or Fed speculation in real time.
It often moves ahead of those narratives, following recurring behavioral and liquidity-driven patterns that only show up when you analyze the data across decades.
Similarly, thousands of stocks follow their own patterns – specific windows of time during which history suggests they’re likely to outperform.
This is the type of insight the TradeSmith Seasonality Tool is designed to provide investors – not just for gold, but for more than 5,000 stocks, ETFs, commodities, and currencies.
Next Tuesday, January 20 at 10 a.m. Eastern, TradeSmith CEO Keith Kaplan will walk through how this system works at the Prediction 2026 event – including how these seasonal windows are identified, tested, and applied in real-world trading.
When you register to attend, you’ll get immediate access to the Seasonality Tool.
Here’s Keith:
You can use the tool to explore the results of our powerful research for the stocks you own or are thinking of buying. It’s available online until Monday, January 19.
Then at our Prediction 2026 webinar, I’ll show you how our Seasonality tool can help you find the best time to buy and sell a stock – down to the day.
You can sign up for the event right here.
Whether you use the Seasonality Tool or not, just recognize that in a high-valuation market like we have today, when you act can matter just as much as what you own.
Coming full circle…
With Bitcoin at a technical inflection point and relative value shifting across the precious metals complex, timing is becoming as important as conviction.
We’ll continue to monitor these developments – and highlight where historical data offers an edge – right here in the Digest.
Have a good evening,
Jeff Remsburg
Disclaimer: I own GLD.